Highlighted text? Practice this concept. Highlighted passages and figures open related questions.
Practice related questions (5)Progress & bookmarks
Current section
2-2 Management Accounting
p. 30
Practice this section 5 linked exam questions with default filters
Progress
Not marked complete
Related questions in this lesson 7
Return on equity1Break-even sales4Contribution, fixed cost and target profit1Payback period decisions1p. 30 · PDF 34
2 - 2 Management Accounting
Management accounting is a method of accounting in which financial and income calculations are performed and managed separately for departments and products in order to facilitate the decision-making (e.g., reviewing corporate activities, establishing management planning) of top management.
p. 31 · PDF 35
2-2-1 Business Analysis
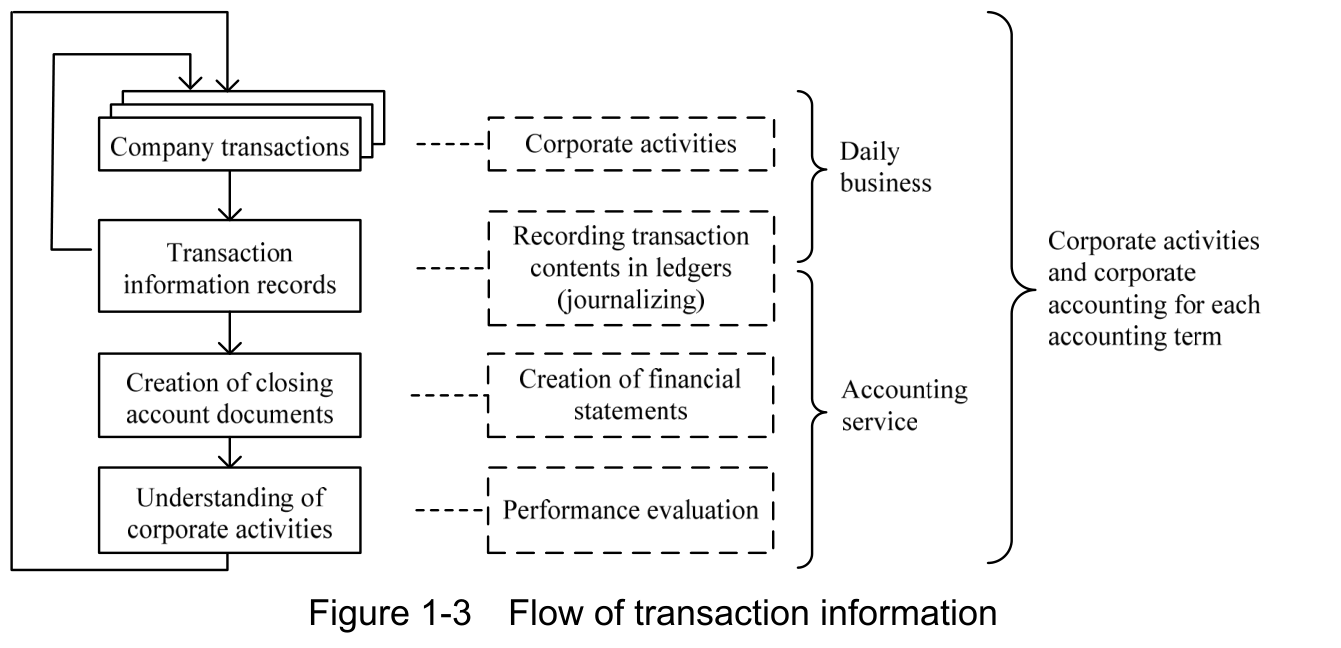
Business analysis is performed to make business decisions by understanding of processes that is required from recording transaction information (i.e., slips) to creating closing account documents, and to read the results of corporate activities in the form of closing account documents.
Source visual description
Original Figure 1-3, Flow of transaction information. The solid sequence is Company transactions, Transaction information records, Creation of closing accounts documents, and Understanding of the corporate activities. Dotted boxes show Corporate activities, Recording transaction contents in ledgers (Journalizing), Creation of financial statements, and Performance evaluation. Braces group Daily business and Accounting service, and Corporate activities and corporate accounting for each accounting term. All original connectors and the complete caption remain intact.
Original visual text
Figure 1-3 Flow of transaction information
(1) Financial indicator
A financial indicator is an index which is represented as a relationship (i.e., ratio) between account titles on closing account documents that are used in business analysis. Some examples of financial indicators are as follows:
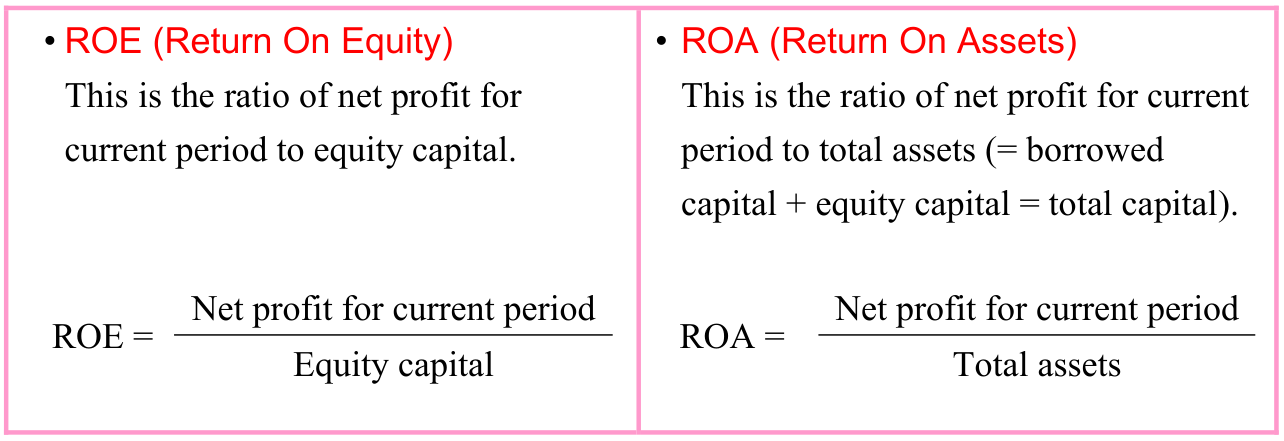
(i) Income indicator (net profit indicator) This is a financial indicator that is used to analyze how efficiently a company is gaining income from an income perspective. Some examples of income indicators are: ROE (Return On Equity), ROA (Return On Assets), ratio of gross profit to net sales (gross profit ratio), ratio of costs to net sales, total capital turnover, and total asset turnover. All of these indicators represent the operational efficiency of capital that was invested into the business activities of a company, and are also used as rough indication for ability to pay dividends.
p. 32 · PDF 36
Source visual description
Original ROE (Return On Equity) and ROA (Return On Assets) box. ROE divides Net profit for current period by Equity capital. ROA divides Net profit for current period by Total assets. The original definitions and fraction arrangements remain side by side.
Original visual text
• ROE (Return On Equity) • ROA (Return On Assets) This is the ratio of net profit for This is the ratio of net profit for current current period to equity capital. period to total assets (= borrowed capital + equity capital = total capital). ROE = Net profit for current period Net profit for current period ROA = Equity capital Total assets
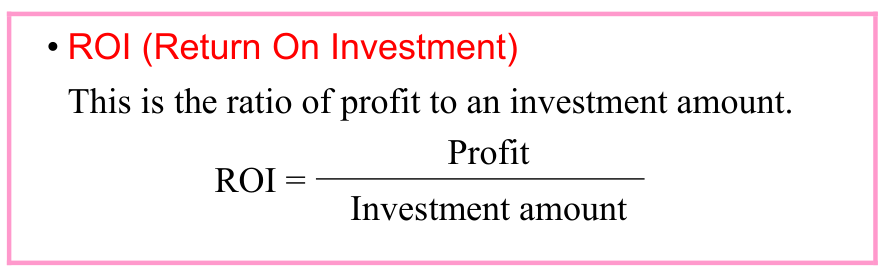
(ii) Profitability indicator This is a financial indicator that indicates an investment effect, such as ROI (Return On Investment). It is a type of income indicator, and is often used in economic efficiency calculations (or economical efficiency analysis) and in determining payout periods.
Source visual description
Original ROI (Return On Investment) box. ROI = Profit / Investment amount. The complete original definition and fraction remain together.
Original visual text
• ROI (Return On Investment) This is the ratio of profit to an investment amount. Profit ROI = Investment amount
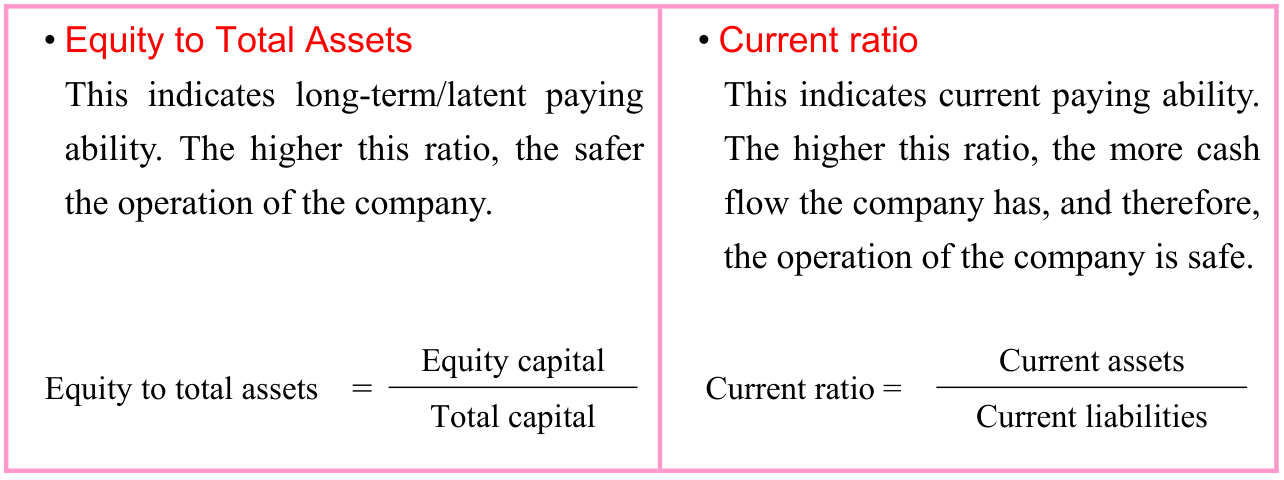
(iii) Safety indicator This is a financial index that is used to analyze if the asset management is sufficient for business activities, if there is sufficient paying ability, and other financial conditions. This is also known as a liquidity index. Some examples of safety indicators are equity to total assets, current ratio, quick ratio, and debt ratio.
Source visual description
Original side-by-side safety indicators. Equity to total assets = Equity capital / Total capital. Current ratio = Current assets / Current liabilities. The original explanations for the two indicators are retained in their original columns.
Original visual text
• Equity to Total Assets • Current ratio This indicates long-term/latent paying This indicates current paying ability. ability. The higher this ratio, the safer The higher this ratio, the more cash the operation of the company. flow the company has, and therefore, the operation of the company is safe. Equity capital Current assets Equity to total assets = Current ratio = Total capital Current liabilities
(2) Economic efficiency calculation (Economical efficiency analysis)
Economic efficiency calculation (economical efficiency analysis) is a form of business analysis which involves selection of the most economical plan amongst multiple candidate
p. 33 · PDF 37
plans at the time of decision-making. In the course of business management, plans must be drafted for production, sales, and logistics, human resources, quality and technical improvement, capital investment, and other important business decisions. Economic efficiency calculation clarifies the objective and targets of comparison, and is used to analyze the relationships between income and cost for each plan in terms of cash flow to investigate the changes in profits.
- • ROI method (Return On Investment method)
This is a method of making decisions on the basis of ROI (Return On Investment). - • PBP method (PayBack Period method)
This is a method of making decisions on the basis of the length of payout periods. · 1 question - • NPV method (Net Present Value method)
This is a method of making decisions on the basis of a comparison of the investment amount and the current value of payback amount. - • IRR method (Internal Rate of Return method)
This is a method of making decisions on the basis of the discount rate at which the net present value of the payback amount and the investment amount are equal.
2-2-2 Break-even Point Analysis
Break-even point analysis is a method of analysis which is used to determine the break-even point, when operating profit is zero and there is no profit or loss. This data is useful for profit planning and other planning. However, opportunity loss (e.g., sales lost because of out of stock) is not counted in the loss that is mentioned here.
(1) Profit planning
Profit planning refers to business activity planning in order to set profit goals that are required in a specific future period and achieve those goals. Break-even point analysis is an especially effective method for short-term profit planning. It is necessary to understand how costs change in response to changes in factors, such as sales or production, and then establish an optimal profit plan.
(2) Direct cost accounting
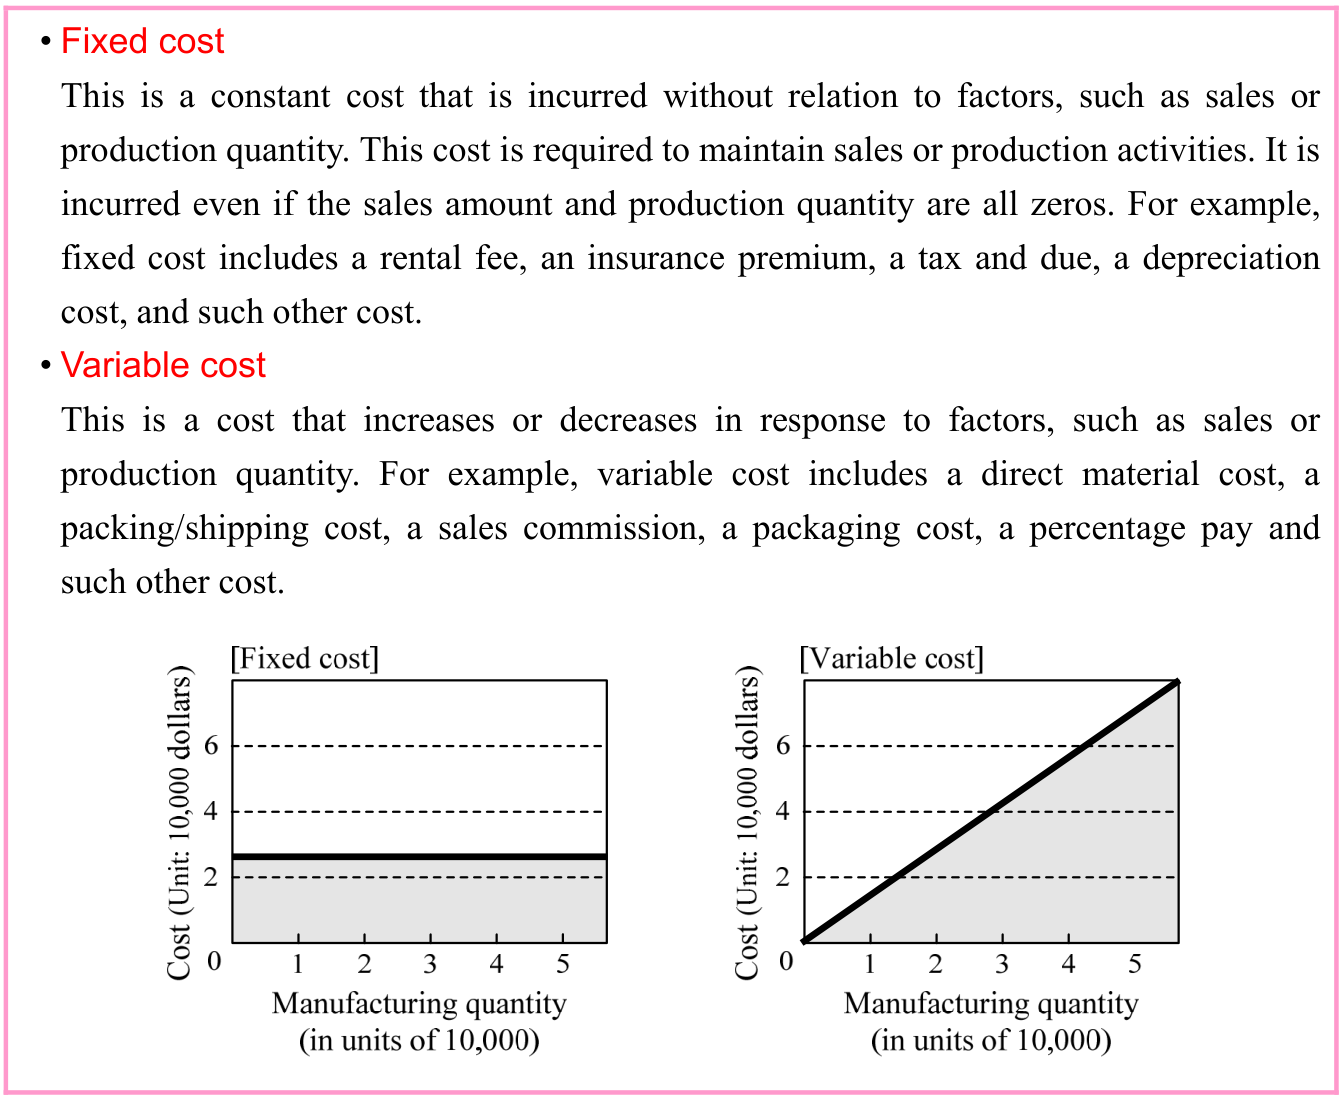
Direct cost accounting is a method of cost control that is used in profit planning. In direct cost accounting, a cost is classified and controlled as follows:
p. 34 · PDF 38
Source visual description
Original Fixed cost and Variable cost definitions with two graphs. Both graphs use Manufacturing quantity (in units of 10,000) horizontally and Cost (in 10,000 dollars) vertically. The Fixed cost plot is horizontal and the Variable cost plot rises diagonally; original scales, dashed reference lines and shading are retained.
Original visual text
• Fixed cost This is a constant cost that is incurred without relation to factors, such as sales or production quantity. This cost is required to maintain sales or production activities. It is incurred even if the sales amount and production quantity are all zeros. For example, fixed cost includes a rental fee, an insurance premium, a tax and due, a depreciation cost, and such other cost. • Variable cost This is a cost that increases or decreases in response to factors, such as sales or production quantity. For example, variable cost includes a direct material cost, a packing/shipping cost, a sales commission, a packaging cost, a percentage pay and such other cost.
The ratio of fixed cost to sales is the fixed cost ratio. The ratio of variable cost to sales is the variable cost ratio.

Source visual description
Original two fractions: Fixed cost ratio = Fixed cost / Sales; Variable cost ratio = Variable cost / Sales.
Original visual text
Fixed cost Variable cost ratio = Variable cost Fixed cost ratio = Sales Sales
(3) Marginal profit (Contribution margin)
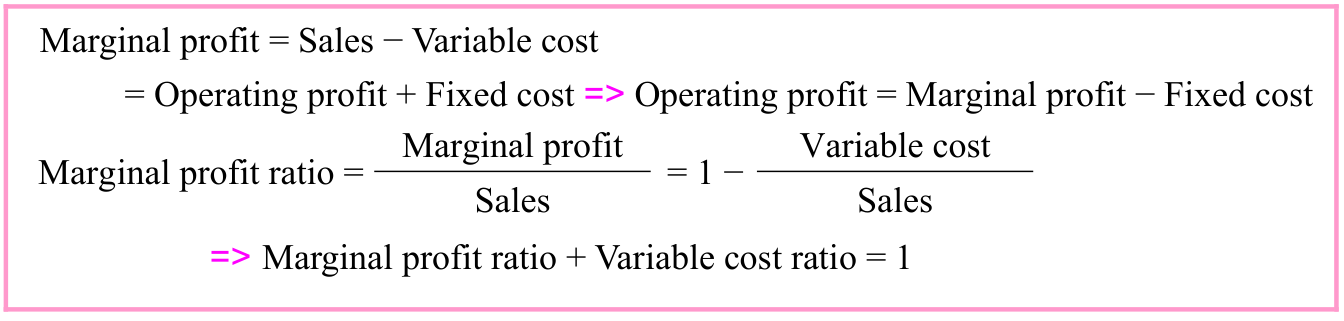
Marginal profit (contribution margin) is the amount of profit (i.e., profit + fixed cost) that can recover fixed cost. The ratio of marginal profit to sales is called the marginal profit ratio. The sum of the marginal profit ratio and variable cost ratio must equal 1 (100%).
Source visual description
Original marginal-profit equations. Marginal profit = Sales - Variable cost = Operating profit + Fixed cost. Operating profit = Marginal profit - Fixed cost. The marginal-profit ratio equals one minus Variable cost / Sales, and Marginal profit ratio + Variable cost ratio = 1. Source arrows and fraction positions are retained.
Original visual text
Marginal profit = Sales − Variable cost = Operating profit + Fixed cost => Operating profit = Marginal profit − Fixed cost Marginal profit Variable cost Marginal profit ratio = = 1 − Sales Sales => Marginal profit ratio + Variable cost ratio = 1
p. 35 · PDF 39
(4) Break-even point sales
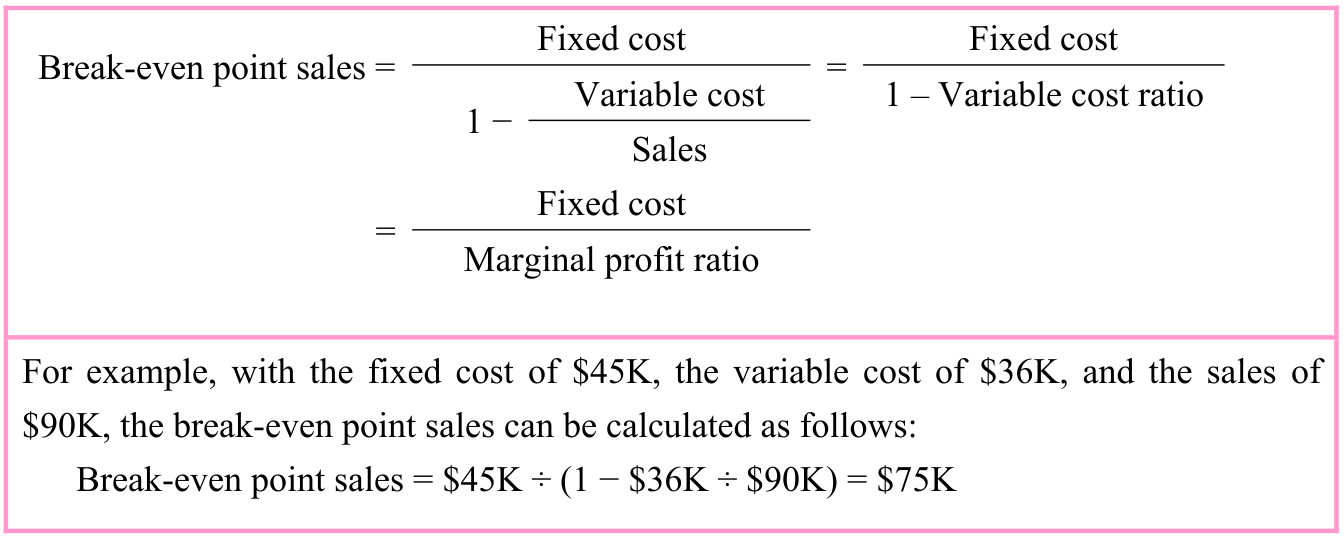
Break-even point sales refers to the volume of sales at the break-even point. Break-even point sales can be calculated by using the following expression if the fixed cost, variable cost, and sales volume are known.
Source visual description
Original break-even point formula with its equivalent fraction forms and worked example. Fixed cost is 45K dollars, Variable cost 36K dollars and Sales 90K dollars. The source computes break-even point sales as 45K divided by (1 - 36K / 90K), giving 75K dollars. No added example or altered amount is supplied.
Original visual text
Fixed cost Fixed cost Break-even point sales = = Variable cost 1 – Variable cost ratio 1 − Sales Fixed cost = Marginal profit ratio For example, with the fixed cost of $45K, the variable cost of $36K, and the sales of $90K, the break-even point sales can be calculated as follows: Break-even point sales = $45K ÷ (1 − $36K ÷ $90K) = $75K
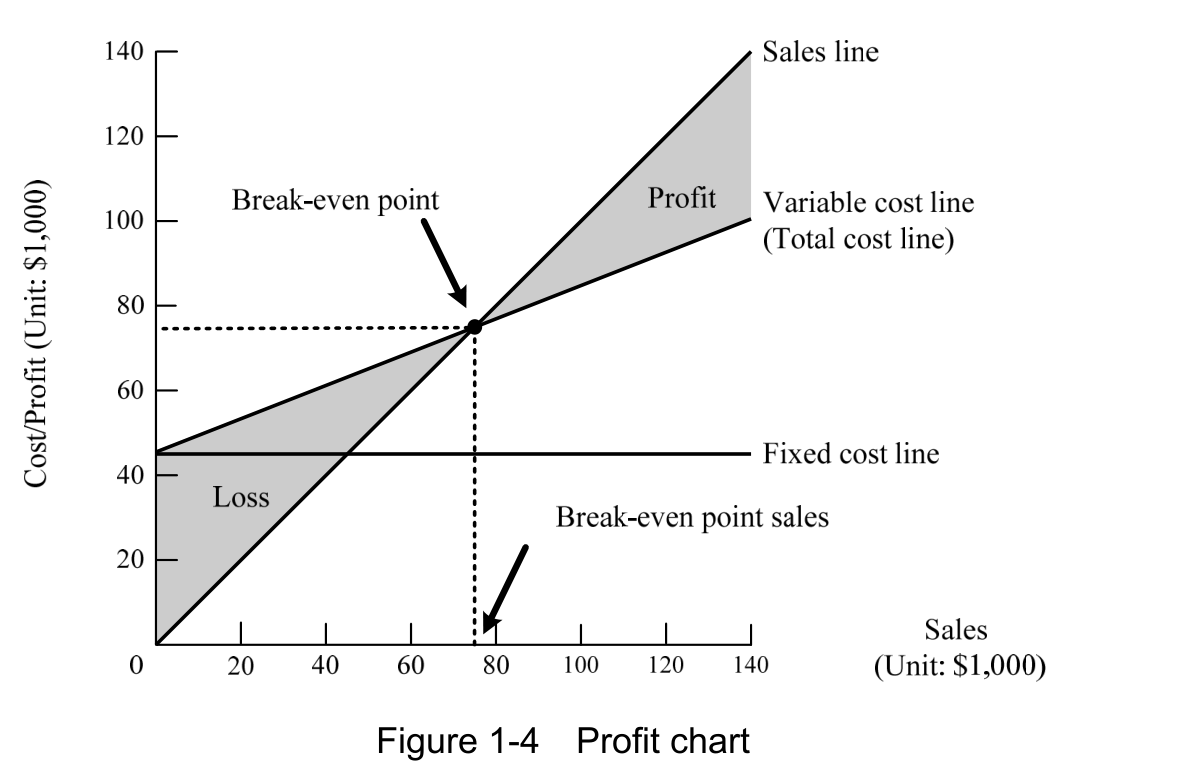
Break-even point sales can also be calculated by using a profit chart (or break-even point chart) other than using formulas. A profit chart is a chart that shows the relationship between sales and cost/profit.
Source visual description
Original Figure 1-4, Profit chart. Both axes use Unit: ,000; the horizontal axis is Sales and the vertical axis Cost/Sales. Labels identify Sales line, Variable cost line (Total cost line), Fixed cost line, Break-even point, Break-even point sales, Profit and Loss. The original 0 to 140 scales, dashed projections and shaded areas remain with the caption.
Original visual text
Figure 1-4 Profit chart
Section progress
Original chapter exercises
Original chapter exercises →New FE Textbook Vol.2 · First Edition, April 2015