Highlighted text? Practice this concept. Highlighted passages and figures open related questions.
Practice related questions (10)Progress & bookmarks
Current section
3-1-3 Probability
p. 41
Practice this section 10 linked exam questions with default filters
Progress
Not marked complete
Related questions in this lesson 13
Probability without replacement3Counting ordered arrangements3Probability from equally likely cases5Expected monetary cost2Original combinations and factorials1Multiplication of independent probabilities1Adding overlapping events1Expected profit with disposal losses1p. 41 · PDF 45
3-1-3 Probability
Source visual description
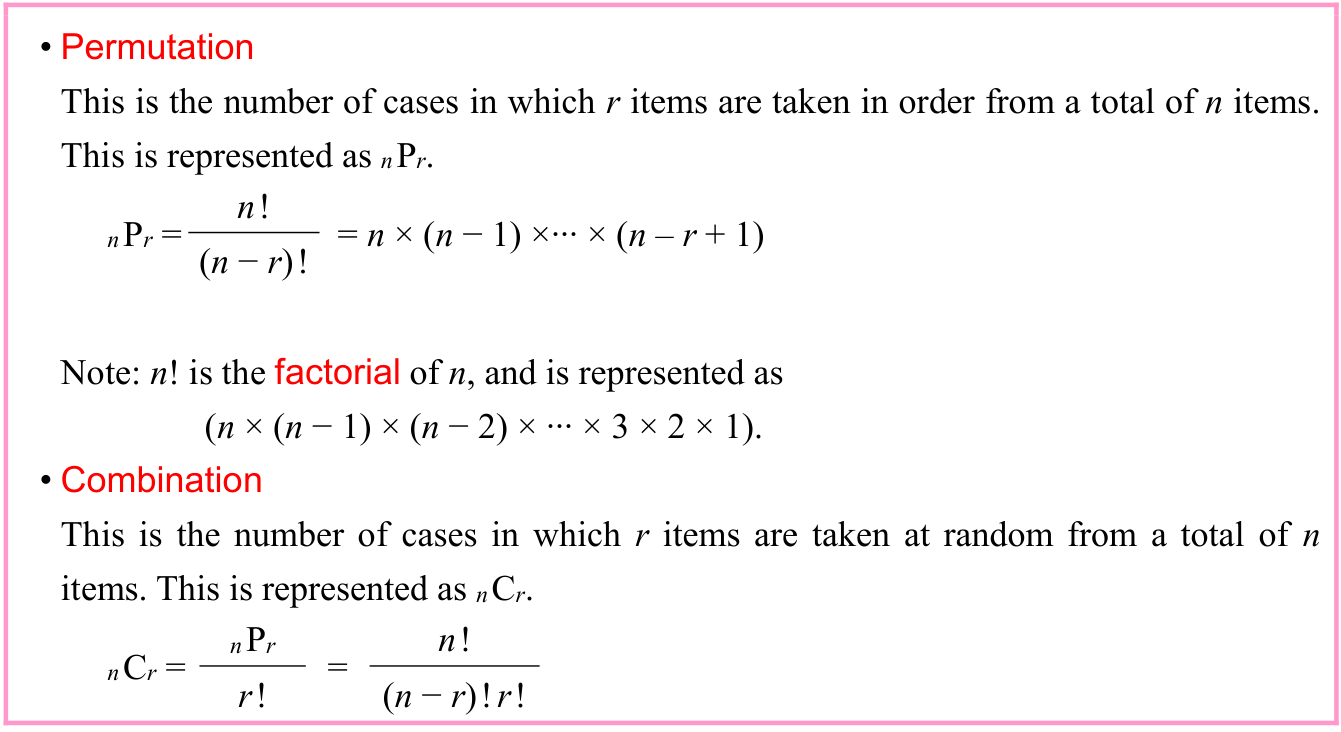
The original n and r are left and right lower indices on P and C. The permutation row, factorial expansion and combination row are transcribed in source order. The source uses an en dash in its last permutation factor; that source character is retained.
Selectable source glyphs (PDF extraction order)
• Permutation This is the number of cases in which r items are taken in order from a total of n items. This is represented as nPr. n! nPr = = n × (n − 1) ×··· × (n – r + 1) (n − r)! Note: n! is the factorial of n, and is represented as (n × (n − 1) × (n − 2) × ··· × 3 × 2 × 1). • Combination This is the number of cases in which r items are taken at random from a total of n items. This is represented as nCr. nPr n! nCr = = r! (n − r)!r!
(1) The probability of rolling a 1 in a single dice throw When a dice is thrown, there are six cases as a whole event. Only one of those cases is a 1, so the probability of rolling a 1 is 1/6.
(2) The probability of rolling a 1 or a 2 in a single dice throw There are two cases to roll a 1 or a 2 in a single dice throw, so the probability is 2/6 (= 1/3).
Source visual description
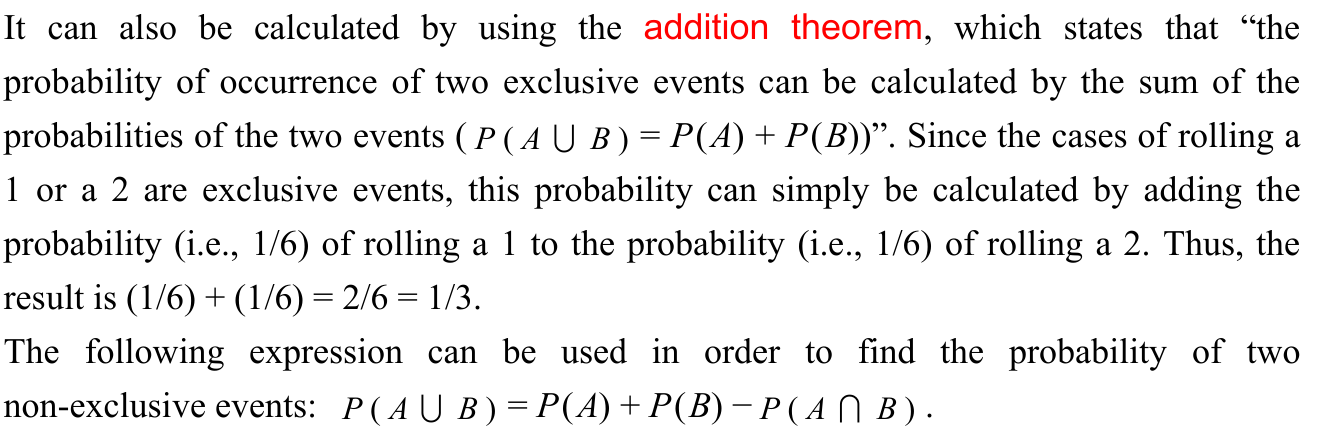
The addition-theorem paragraph and its following non-exclusive-event expression are retained together. The inline slash fractions remain slash fractions.
Selectable source glyphs (PDF extraction order)
It can also be calculated by using the addition theorem, which states that “the probability of occurrence of two exclusive events can be calculated by the sum of the probabilities of the two events ( P ( A B ) = P(A) + P(B))”. Since the cases of rolling a ∪ 1 or a 2 are exclusive events, this probability can simply be calculated by adding the probability (i.e., 1/6) of rolling a 1 to the probability (i.e., 1/6) of rolling a 2. Thus, the result is (1/6) + (1/6) = 2/6 = 1/3. The following expression can be used in order to find the probability of two non-exclusive events: P ( A B ) = P(A) + P(B) − P ( A B ) . ∪ ∩
p. 42 · PDF 46
(3) The probability of rolling a 1, and a 2 in order in a two dice throws When a dice is thrown twice, there are 6 × 6 = 36 cases as a whole event. Then, there is only one case to roll a 1 on the first roll and a 2 on the second roll, so the probability of rolling a 1 and a 2 in order is 1/36.
Source visual description
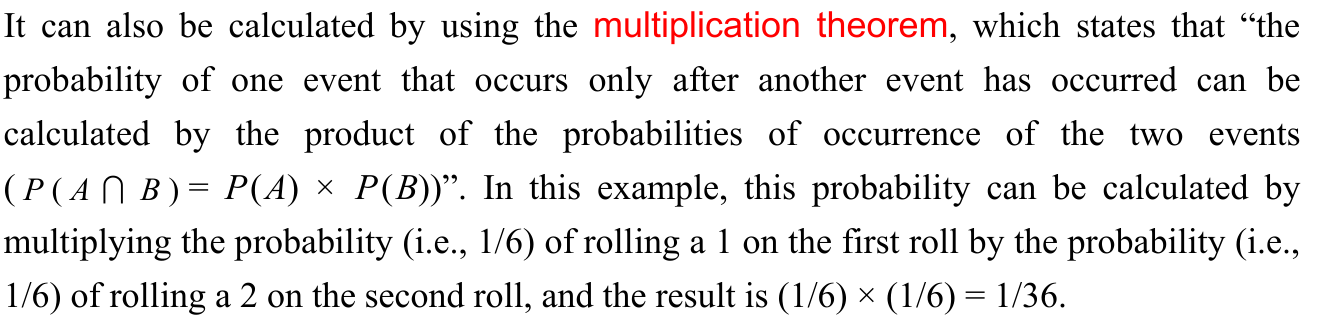
The source paragraph gives P(A intersection B) equals P(A) times P(B), followed by the printed two-throw slash-fraction calculation. No conditional probability term has been added.
Selectable source glyphs (PDF extraction order)
It can also be calculated by using the multiplication theorem, which states that “the probability of one event that occurs only after another event has occurred can be calculated by the product of the probabilities of occurrence of the two events ( P ( A B ) = P(A) × P(B))”. In this example, this probability can be calculated by ∩ multiplying the probability (i.e., 1/6) of rolling a 1 on the first roll by the probability (i.e., 1/6) of rolling a 2 on the second roll, and the result is (1/6) × (1/6) = 1/36.
As with the dice in this example, when the probability process in which a past event (i.e., rolling a 1 on the first roll) does not affect the probability of the next event (i.e., rolling a 2 on the second roll), this is known as a Markov process. (Generally, a Markov process in which the next event is determined only by the current status is known as a simple Markov process.)
Source visual description
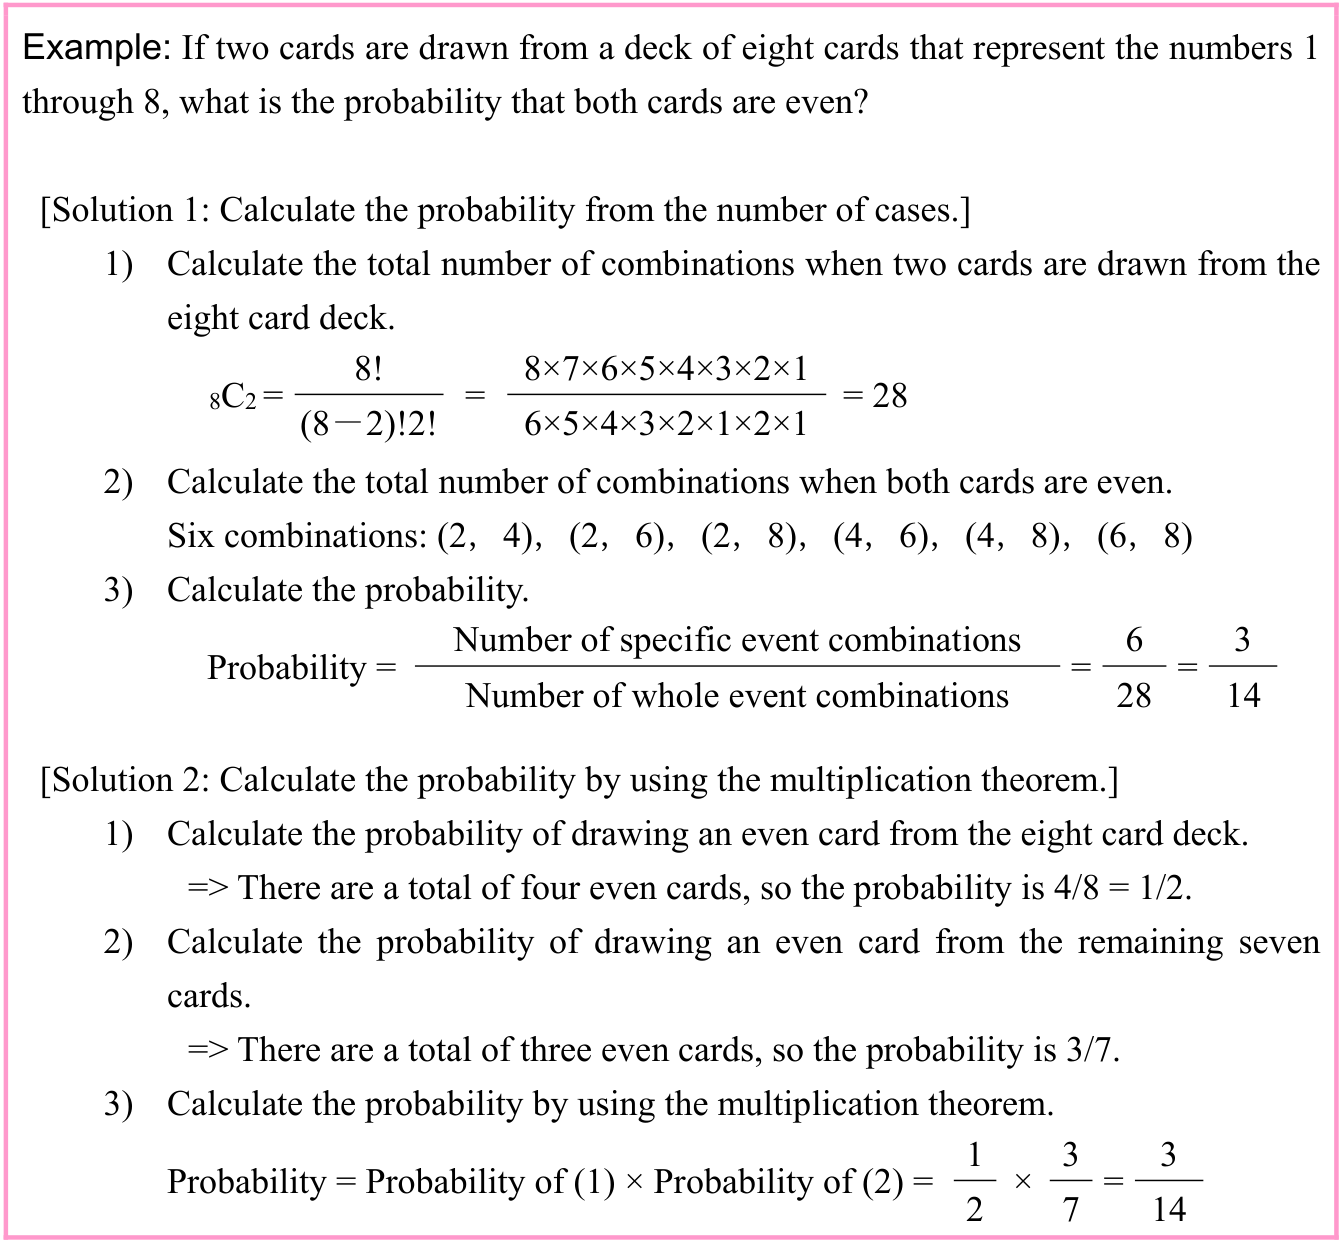
The original example draws two cards from the numbered eight-card deck. Both complete source solutions remain intact. The six listed even pairs are (2,4), (2,6), (2,8), (4,6), (4,8), (6,8). The original numerator and denominator expansions and final three-fourteenths results are transcribed below.
Selectable source glyphs (PDF extraction order)
Example: If two cards are drawn from a deck of eight cards that represent the numbers 1 through 8, what is the probability that both cards are even? [Solution 1: Calculate the probability from the number of cases.] 1) Calculate the total number of combinations when two cards are drawn from the eight card deck. 8! 8×7×6×5×4×3×2×1 8C2 = = = 28 (8-2)!2! 6×5×4×3×2×1×2×1 2) Calculate the total number of combinations when both cards are even. Six combinations: (2,4),(2,6),(2,8),(4,6),(4,8),(6,8) 3) Calculate the probability. Number of specific event combinations = 6 = 3 Probability = Number of whole event combinations 28 14 [Solution 2: Calculate the probability by using the multiplication theorem.] 1) Calculate the probability of drawing an even card from the eight card deck. => There are a total of four even cards, so the probability is 4/8 = 1/2. 2) Calculate the probability of drawing an even card from the remaining seven cards. => There are a total of three even cards, so the probability is 3/7. 3) Calculate the probability by using the multiplication theorem. 1 × 3 = 3 Probability = Probability of (1) × Probability of (2) = 2 7 14
p. 43 · PDF 47

Source visual description
Expected value equals capital Sigma followed by the parenthesized product of Benefit/Loss of event and Probability of occurrence. The original note says Sigma means summation.
Selectable source glyphs (PDF extraction order)
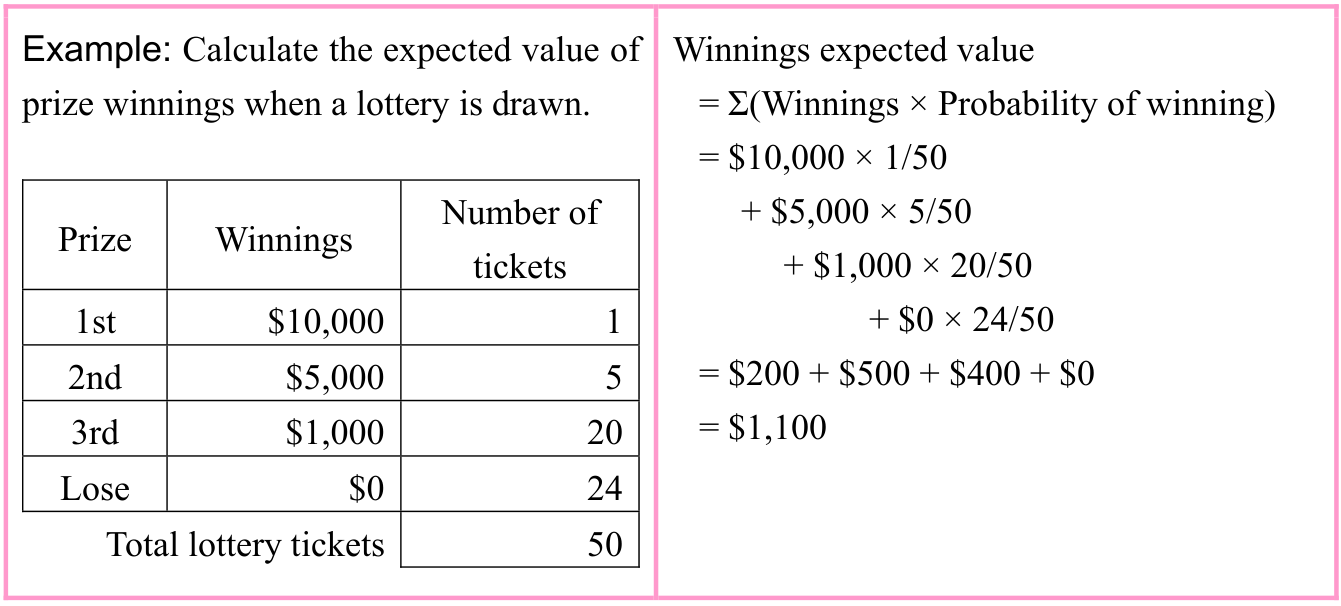
Expected value = Σ(Benefit/Loss of event × Probability of occurrence) Note: Σ means summation.
For example, the following calculation can be used to calculate the expected value when a dice is rolled one time.

Source visual description
The original six displayed terms each multiply a die value by the stacked fraction one-sixth; the final source value is 3.5.
Selectable source glyphs (PDF extraction order)
Dice roll expected value = 1 × 1 + 2 × 1 + 3 × 1 + 4 × 1 + 5 × 1 + 6 × 1 = 3.5 6 6 6 6 6 6
Source visual description
The original table columns are Prize, Winnings, Number of tickets. Rows are 1st, $10,000, 1; 2nd, $5,000, 5; 3rd, $1,000, 20; Lose, $0, 24; Total lottery tickets, 50. The calculation on the right retains the printed Sigma and all four original terms, ending at $1,100.
Selectable source glyphs (PDF extraction order)
Example: Calculate the expected value of Winnings expected value prize winnings when a lottery is drawn. = Σ(Winnings × Probability of winning) = $10,000 × 1/50 + $5,000 × 5/50 Number of Prize Winnings + $1,000 × 20/50 tickets + $0 × 24/50 1st $10,000 1 = $200 + $500 + $400 + $0 2nd $5,000 5 = $1,100 3rd $1,000 20 Lose $0 24 Total lottery tickets 50
Section progress
Original chapter exercises
Original chapter exercises →New FE Textbook Vol.2 · First Edition, April 2015