Highlighted text? Practice this concept. Highlighted passages and figures open related questions.
Practice related questions (1)Progress & bookmarks
Current section
3-1-7 Graph Theory
p. 54
Practice this section 1 linked exam question with default filters
Progress
Not marked complete
Related questions in this lesson 1
Graph adjacency representation1Graph adjacency matrix example1p. 54 · PDF 58
3-1-7 Graph Theory
Graph theory refers to a theory for using a graph. A graph is composed of a set of vertices V, and a set of edges (or branches) E which connect those vertices. There are two types of graphs in relation to their edges: undirected graphs which have undirected edges, and directed graphs which have directed edges.
p. 55 · PDF 59
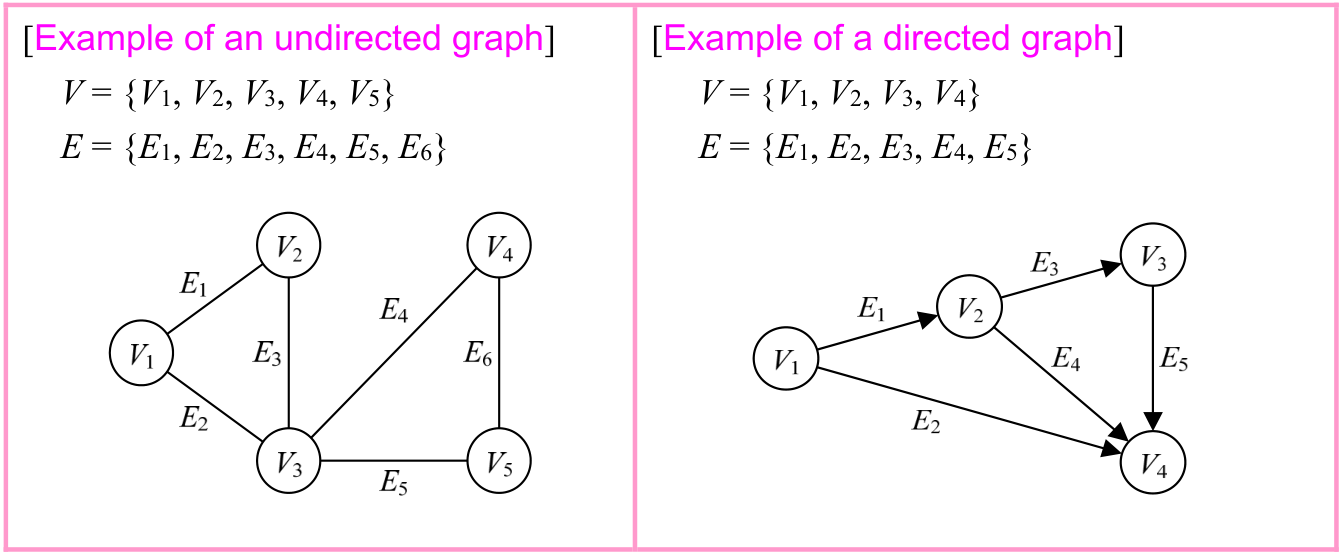
Source visual description
The undirected panel has vertices V1 through V5 and edges E1 through E6. Its edges join V1-V2 (E1), V1-V3 (E2), V2-V3 (E3), V3-V4 (E4), V3-V5 (E5), V4-V5 (E6). The directed panel has V1 through V4 and E1 through E5: E1 points V1 to V2; E2 V1 to V4; E3 V2 to V3; E4 V2 to V4; E5 V3 to V4. All original vertex and edge indices are lower indices.
Selectable source glyphs (PDF extraction order)
[Example of an undirected graph] [Example of a directed graph] V = {V1, V2, V3, V4, V5} V = {V1, V2, V3, V4} E = {E1, E2, E3, E4, E5, E6} E = {E1, E2, E3, E4, E5}
A set of adjacent vertices and edges in a graph is called a walk. There are four types of walks, as described below. Examples of each walk are written down by using the undirected graph above.
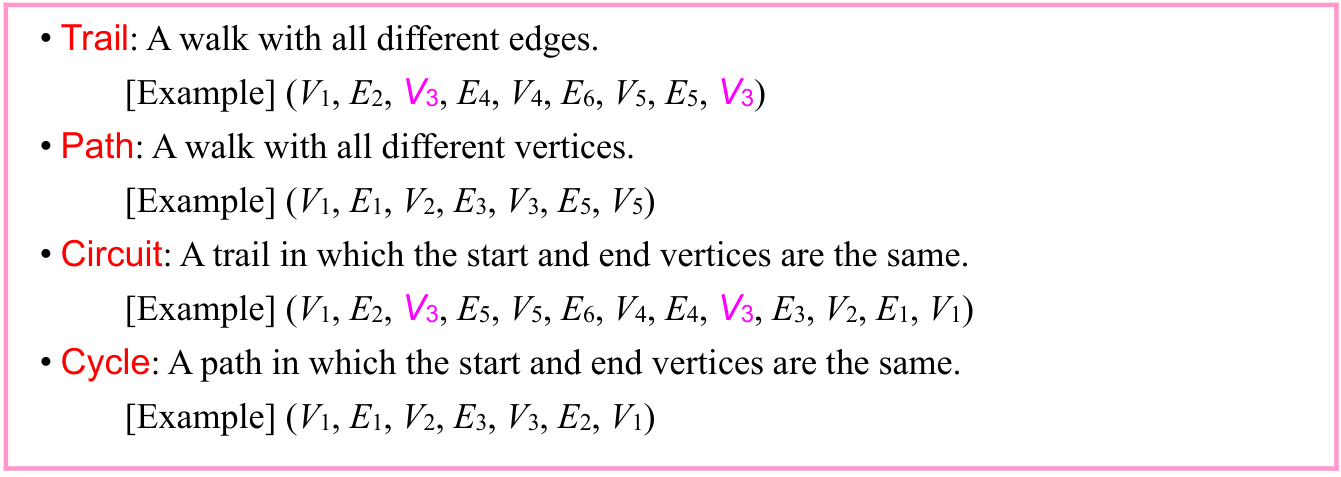
Source visual description
The four source definitions and examples appear in order Trail, Path, Circuit and Cycle. Their full printed vertex/edge sequences are transcribed below in exactly that order, retaining every repeated vertex and original lower index.
Selectable source glyphs (PDF extraction order)
• Trail: A walk with all different edges. [Example] (V1, E2, V3, E4, V4, E6, V5, E5, V3) • Path: A walk with all different vertices. [Example] (V1, E1, V2, E3, V3, E5, V5) • Circuit: A trail in which the start and end vertices are the same. [Example] (V1, E2, V3, E5, V5, E6, V4, E4, V3, E3, V2, E1, V1) • Cycle: A path in which the start and end vertices are the same. [Example] (V1, E1, V2, E3, V3, E2, V1)
p. 56 · PDF 60
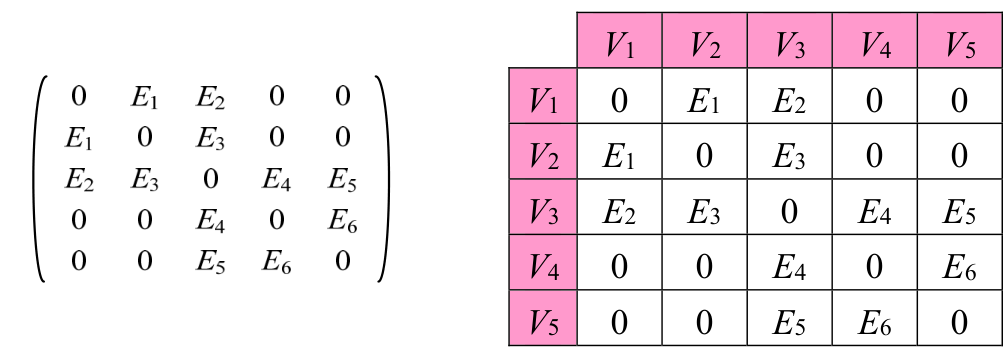
Source visual description
The source matrix and adjacent labelled array have row/column order V1,V2,V3,V4,V5. Their five rows are (0,E1,E2,0,0); (E1,0,E3,0,0); (E2,E3,0,E4,E5); (0,0,E4,0,E6); (0,0,E5,E6,0). All E numbers and V labels are lower indices. Both original representations remain together.
Selectable source glyphs (PDF extraction order)
V1 V2 V3 V4 V5 V1 0 E1 E2 0 0 V2 E1 0 E3 0 0 V3 E2 E3 0 E4 E5 V4 0 0 E4 0 E6 V5 0 0 E5 E6 0
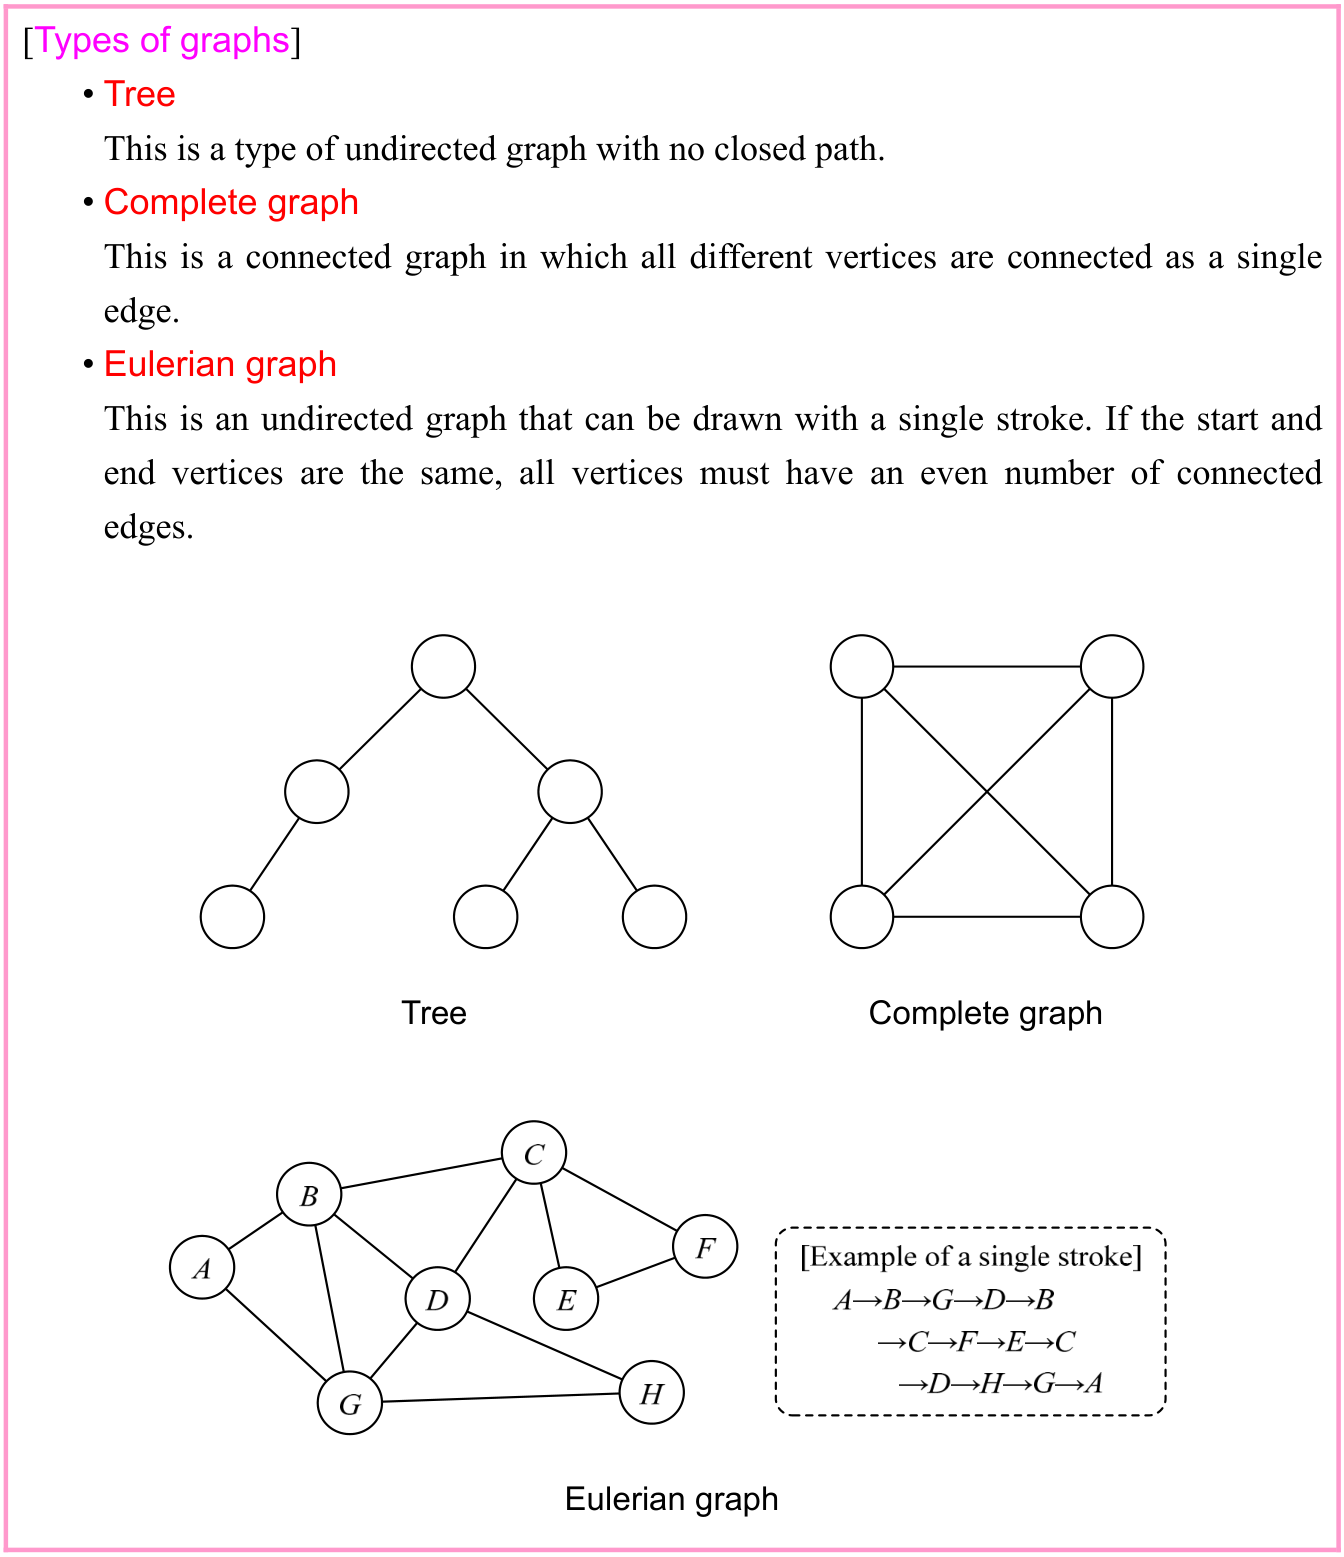
Source visual description
The Types of graphs box contains the definitions of Tree, Complete graph and Eulerian graph. Its tree has six unlabelled vertices, its complete graph has four vertices and all six edges, and its Eulerian graph has labelled vertices A through H. The example of a single stroke reads A→B→G→D→B→C→F→E→C→D→H→G→A.
Selectable source glyphs (PDF extraction order)
[Types of graphs] • Tree This is a type of undirected graph with no closed path. • Complete graph This is a connected graph in which all different vertices are connected as a single edge. • Eulerian graph This is an undirected graph that can be drawn with a single stroke. If the start and end vertices are the same, all vertices must have an even number of connected edges. Complete graph Tree Eulerian graph
p. 57 · PDF 61
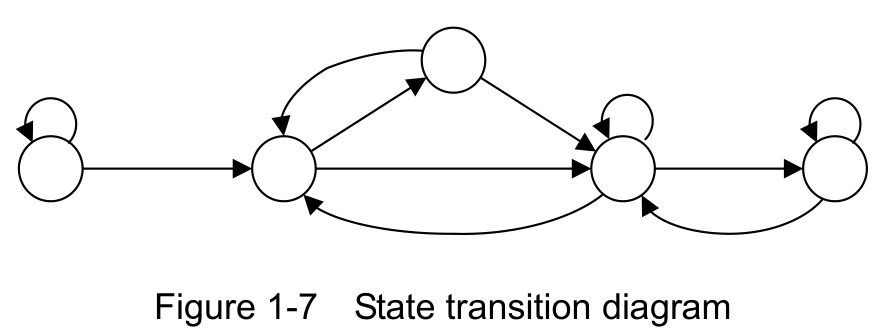
A state transition diagram, which shows the change in state of an object over time or in response to external events, can also be referred to as a type of directed graph. However, a state transition diagram sometimes has edges which include a vertex that connects back to itself, so mathematically this means it may not actually be a graph.
Source visual description
The original diagram has five unlabelled circular states: a leftmost state, a second lower state, an upper state, a third lower state and a rightmost state. Arrows connect the leftmost state to the second; the second and upper states in both directions; the upper state to the third lower state; the second and third lower states in both directions; and the third lower and rightmost states in both directions. Self-loops appear at the leftmost, third lower and rightmost states. The original caption is Figure 1-7 State transition diagram.
Selectable source glyphs (PDF extraction order)
Figure 1-7 State transition diagram
A graph is used to solve problems, such as a shortest path problem or a traveling salesman problem.
Section progress
Original chapter exercises
Original chapter exercises →New FE Textbook Vol.2 · First Edition, April 2015