Highlighted text? Practice this concept. Highlighted passages and figures open related questions.
Practice related questions (4)Progress & bookmarks
Current section
3-5 Business Analysis
p. 83
Practice this section 4 linked exam questions with default filters
Progress
Not marked complete
Related questions in this lesson 8
KJ method1Radar chart1ABC analysis2Brainstorming rules1KJ grouping process1Monte Carlo simulation1Data mining1Z charts1p. 83 · PDF 87
3 - 5 Business Analysis
Business analysis is the investigation and analysis of current business operations in order to improve its efficiency and quality. The results of business analysis are used in operational improvement and in optimal operational planning. In business analysis, a variety of information (or data) concerning business operations is collected, then organized and analyzed. This subsection describes techniques for data collection, organizing, and analysis.
3-5-1 Data Collection Techniques
Data collection techniques are techniques for the collection of various kinds of information (or data). The following are typical data collection techniques.
- • Brainstorming
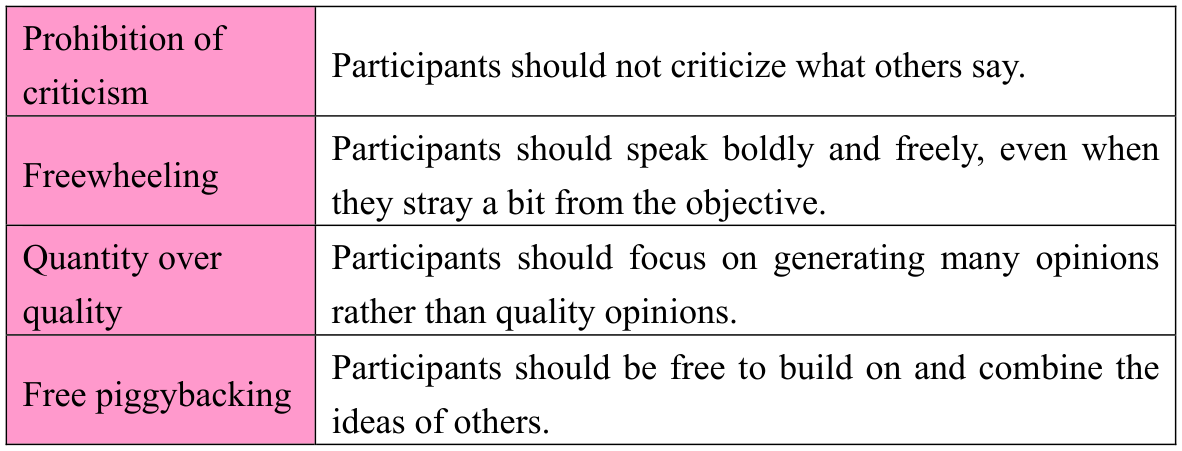
This is a method for collecting many opinions or ideas concerning a problem to be solved or a thing to be achieved. When the following four rules are followed, speakers can freely put forth thoughts and opinions, which can be expected to lead to innovative ideas.
| Prohibition of criticism | Participants should not criticize what others say. |
|---|---|
| Freewheeling | Participants should speak boldly and freely, even when they stray a bit from the objective. |
| Quantity over quality | Participants should focus on generating many opinions rather than quality opinions. |
| Free piggybacking | Participants should be free to build on and combine the ideas of others. |
- • Questionnaire survey
This is a method of collecting large volumes of data by organizing items to be surveyed in the form of questionnaire items, distributing the survey to many people, and collecting the responses. It offers merit as a way to collect large volumes of data at low cost. However, it presents problems in that, depending on the content of the questions and the recipients. For example, responses may deviate from the target or comments may be biased, which results in inability to collect valid data. - • Interview (Interview survey)
This is a method of meeting and speaking directly with people to collect data. Interviews are commonly conducted with individual persons or with groups. In some
p. 84 · PDF 88
cases, it can be conducted by telephone. Since the interview is conducted by talking directly, it enables the collection of high-quality comments that meet the purpose of the survey. However, time and cost requirements present a difficulty.
- • Focus group
This refers to a group that is selected from a larger whole in order to collect information, or to the method of collecting information through interactive interviews with such groups. Focus groups are used for collecting prior information (e.g., advance information collection to narrow down questionnaire items and content before a questionnaire for the whole is conducted). They are also used as a means of collecting opinions from specified customers concerning new products, within marketing and other activities.
3-5-2 Data Organizing Techniques
Data organizing techniques are techniques for organizing collected information (or data). The following are typical data organizing techniques.
| 1) Information collection | Data is collected through brainstorming or other methods. |
|---|---|
| 2) Creation of cards | A card is created for each piece of data. |
| 3) Grouping | Data with similar content is formed into groups. |
| 4) Creation of headers | A header (title or nameplate) is attached to each group. |
| 5) Diagramming | For each group, all cards are pasted onto a board. These are then organized by drawing around cards with arrows and outlines. |
| 6) Documentation | The content is documented on the basis of the diagramming. |
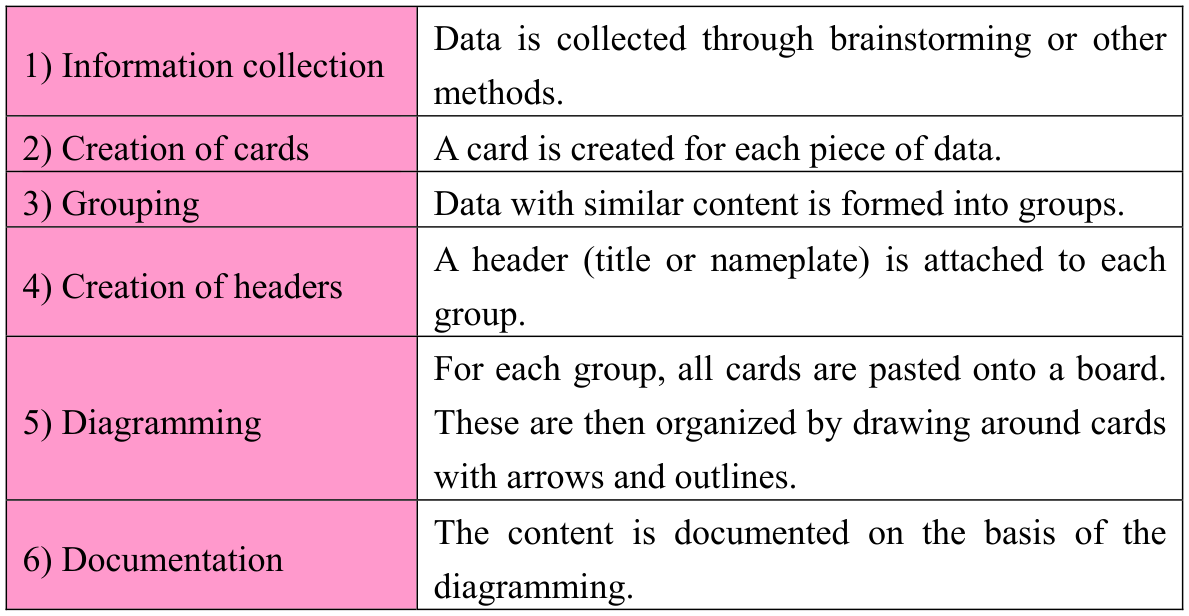
Note: Steps 3) and 4) are repeated until those groups become 5 or 6 groups at the end.
- • Buzz session
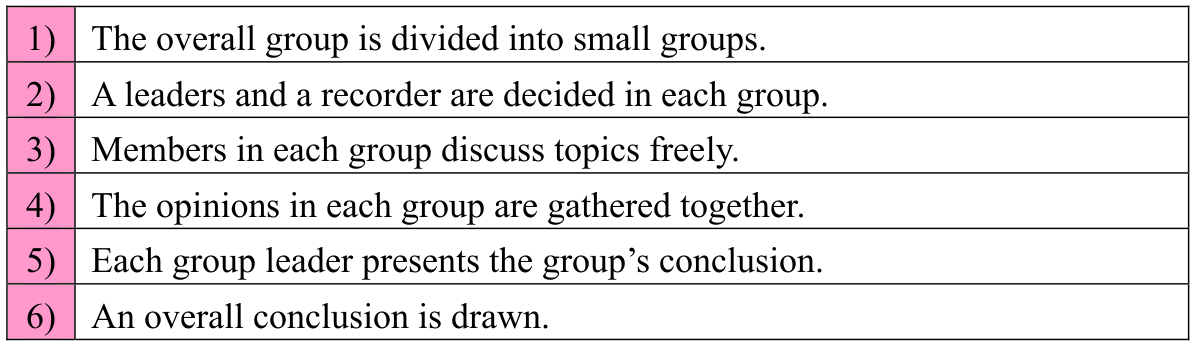
This is a method for studying problems in each small groups and drawing out
p. 85 · PDF 89
conclusions for the whole on the basis of conclusions for each group.
| 1) The overall group is divided into small groups. | |
| 2) A leaders and a recorder are decided in each group. | |
| 3) Members in each group discuss topics freely. | |
| 4) The opinions in each group are gathered together. | |
| 5) Each group leader presents the group’s conclusion. | |
| 6) An overall conclusion is drawn. |
- • Delphi method
This is a method that uses anonymous questionnaires survey to collect and statistically aggregate opinions from a large number of professionals and experts when forecasts are made on the basis of current trends. Through repeated feedback and reconsideration of the aggregated opinions, the opinions are made to converge, and the accuracy of the forecasts is enhanced. - • Monte Carlo method
This is a method that derives approximate solutions by carrying out a large number of simulations and numerical analyses using probability distributions and random numbers. Monte Carlo methods include the bootstrap method, by which characteristics of the population are estimated through a large number of samplings of collected information (i.e., samples). This is used when collected information is scarce and precise data analysis is difficult. · 1 question - • Scenario writing method
This is a method that works out a scenario by arranging collected information in order of time. This is used for future forecasting of technology trend etc.
3-5-3 Diagrams and Graphs
Diagrams and graphs represent the various collected information (or data) and the results of organizing information, in visual and easily understood form. In particular, graphs are available in many types, so it is important to make selection of the appropriate graph for the application.
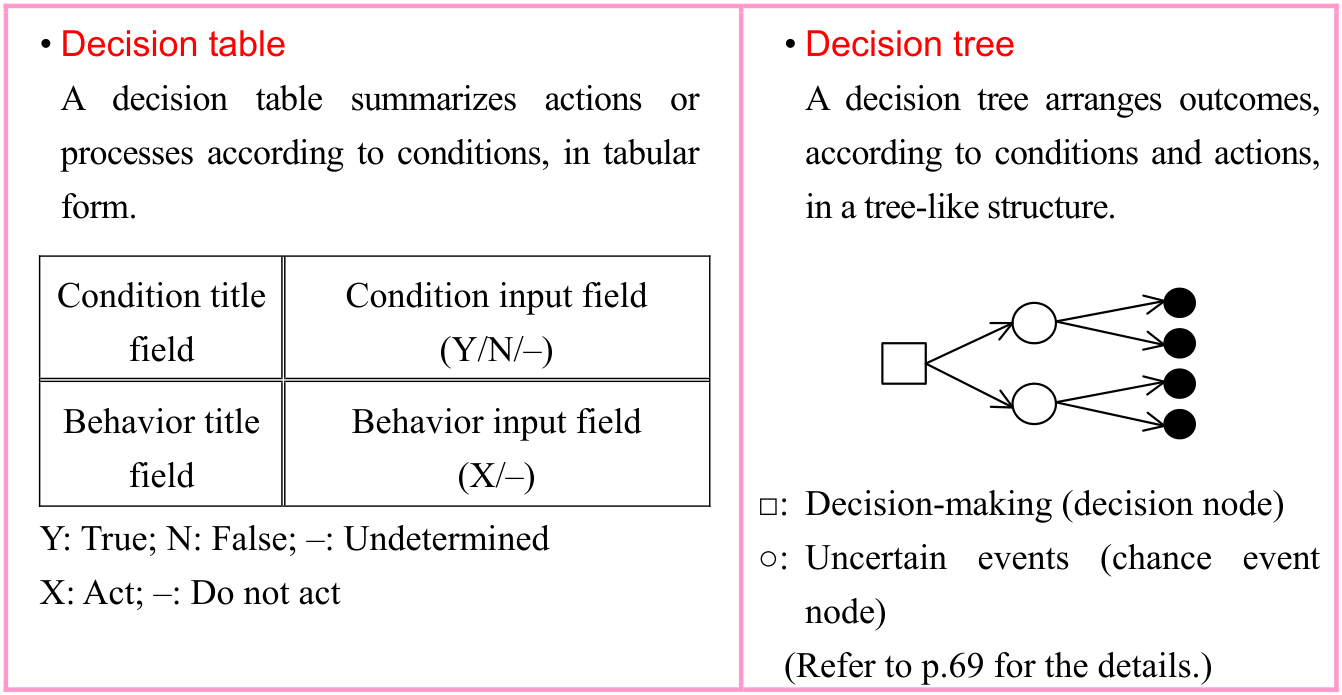
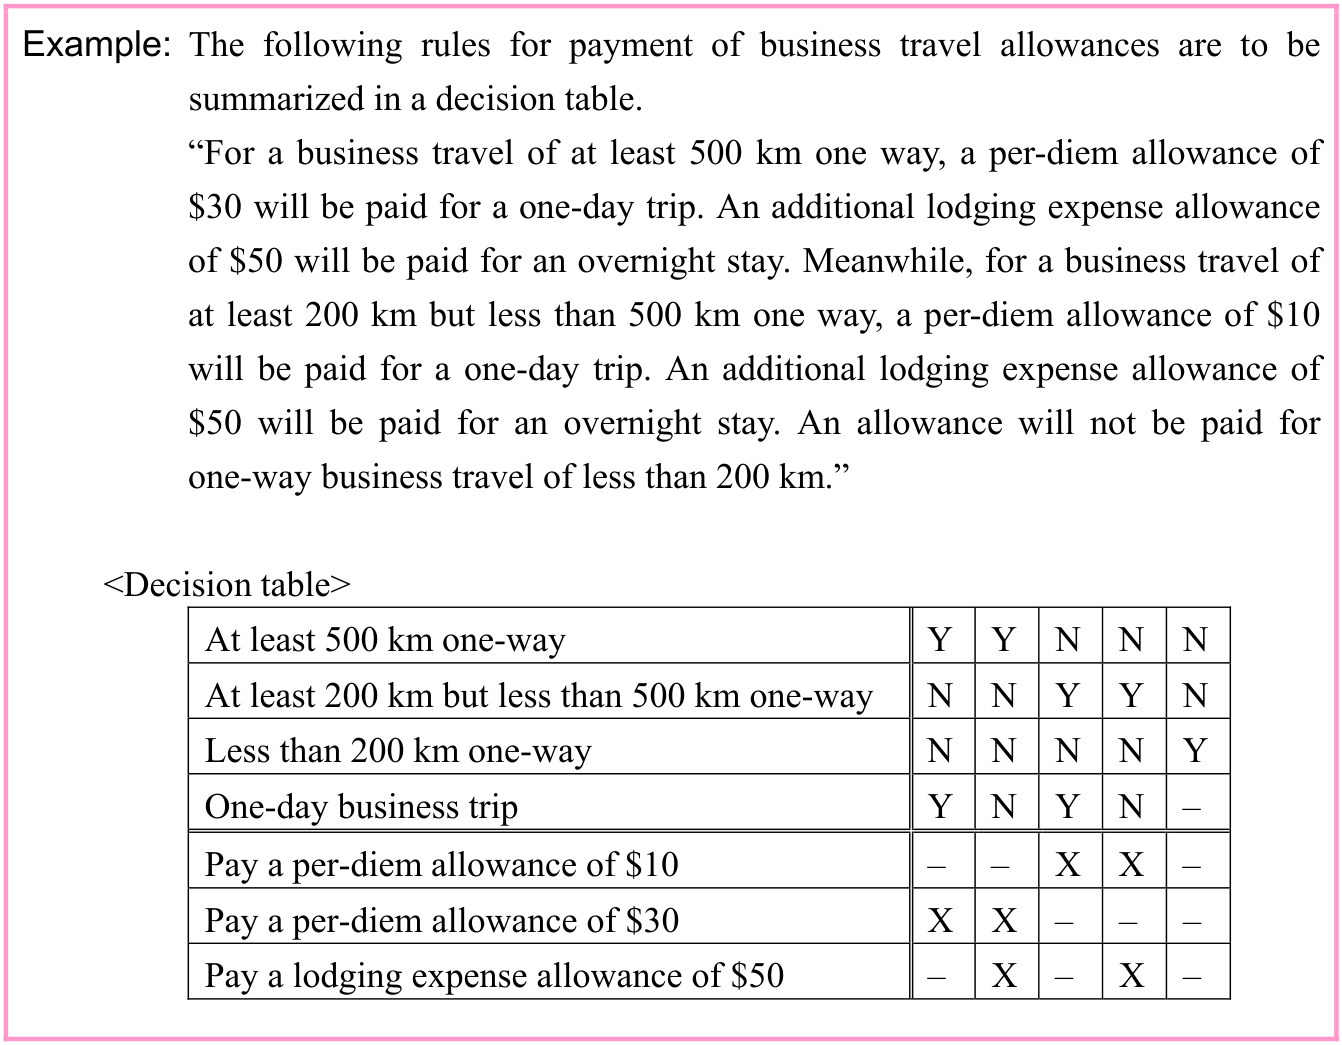
(1) Decision table / Decision tree
Decision tables and decision trees are diagrams that summarize actions, processes, and outcomes according to conditions. These are used to organize complex conditions or prevent checklist items from being overlooked.
p. 86 · PDF 90
Source visual description
Original source visual. Selectable source labels and wording: • Decision table • Decision tree A decision table summarizes actions or A decision tree arranges outcomes, processes according to conditions, in tabular according to conditions and actions, form. in a tree-like structure. Condition title Condition input field field (Y/N/–) Behavior title Behavior input field field (X/–) □: Decision-making (decision node) Y: True; N: False; –: Undetermined ○: Uncertain events (chance event X: Act; –: Do not act node) (Refer to p.69 for the details.)
Original visual text
• Decision table • Decision tree A decision table summarizes actions or A decision tree arranges outcomes, processes according to conditions, in tabular according to conditions and actions, form. in a tree-like structure. Condition title Condition input field field (Y/N/–) Behavior title Behavior input field field (X/–) □: Decision-making (decision node) Y: True; N: False; –: Undetermined ○: Uncertain events (chance event X: Act; –: Do not act node) (Refer to p.69 for the details.)
Source visual description
Original source visual. Selectable source labels and wording: Example: The following rules for payment of business travel allowances are to be summarized in a decision table. “For a business travel of at least 500 km one way, a per-diem allowance of $30 will be paid for a one-day trip. An additional lodging expense allowance of $50 will be paid for an overnight stay. Meanwhile, for a business travel of at least 200 km but less than 500 km one way, a per-diem allowance of $10 will be paid for a one-day trip. An additional lodging expense allowance of $50 will be paid for an overnight stay. An allowance will not be paid for one-way business travel of less than 200 km.” <Decision table> At least 500 km one-way Y Y N N N At least 200 km but less than 500 km one-way N N Y Y N Less than 200 km one-way N N N N Y One-day business trip Y N Y N – Pay a per-diem allowance of $10 – – X X – Pay a per-diem allowance of $30 X X – – – Pay a lodging expense allowance of $50 – X – X –
Original visual text
Example: The following rules for payment of business travel allowances are to be summarized in a decision table. “For a business travel of at least 500 km one way, a per-diem allowance of $30 will be paid for a one-day trip. An additional lodging expense allowance of $50 will be paid for an overnight stay. Meanwhile, for a business travel of at least 200 km but less than 500 km one way, a per-diem allowance of $10 will be paid for a one-day trip. An additional lodging expense allowance of $50 will be paid for an overnight stay. An allowance will not be paid for one-way business travel of less than 200 km.” <Decision table> At least 500 km one-way Y Y N N N At least 200 km but less than 500 km one-way N N Y Y N Less than 200 km one-way N N N N Y One-day business trip Y N Y N – Pay a per-diem allowance of $10 – – X X – Pay a per-diem allowance of $30 X X – – – Pay a lodging expense allowance of $50 – X – X –
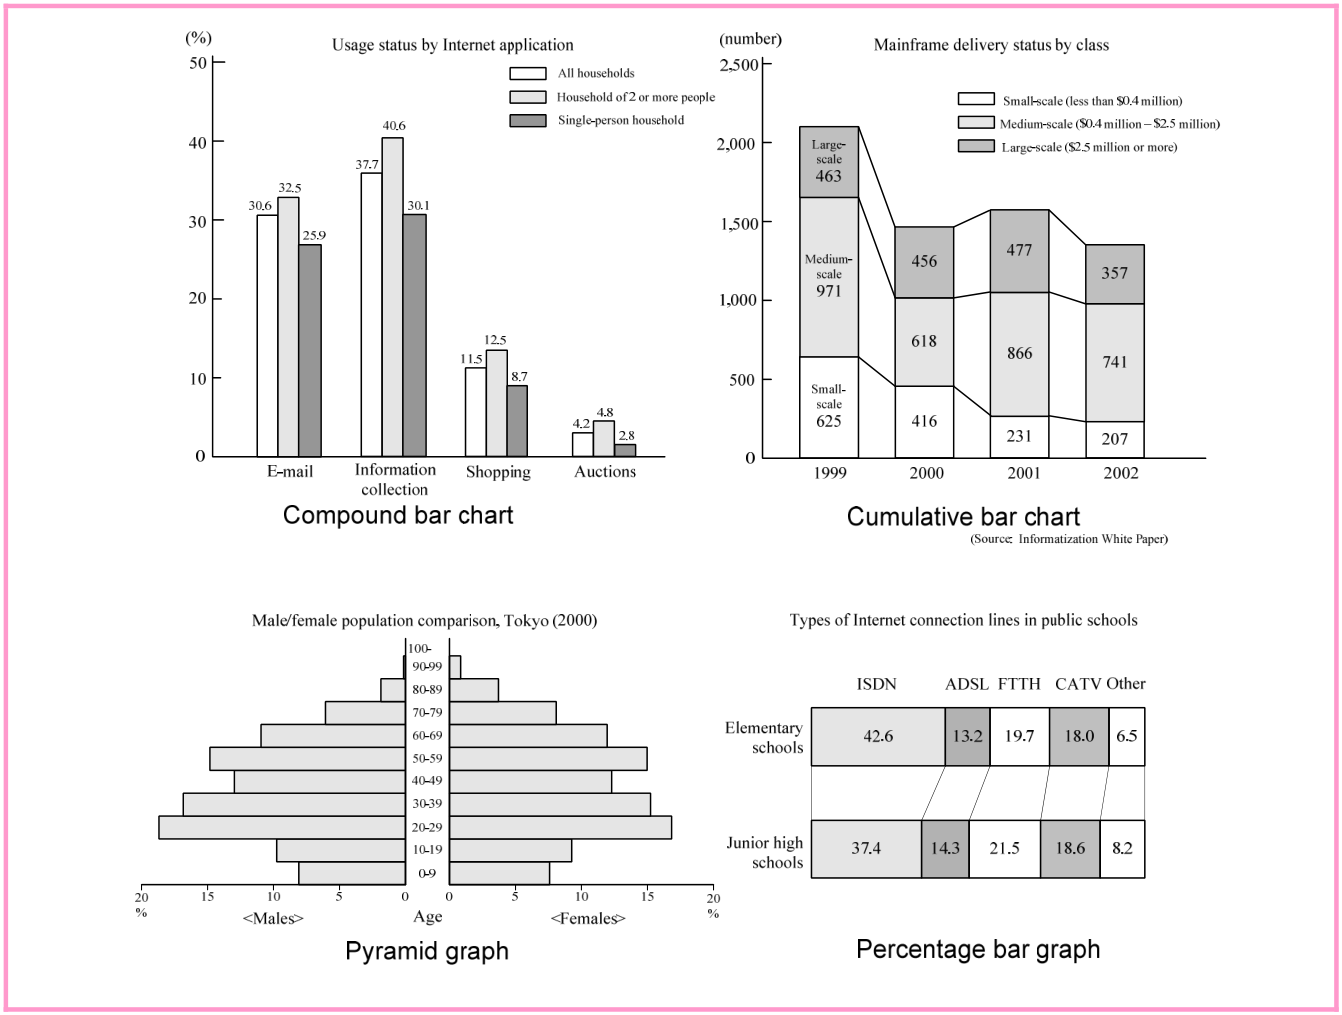
(2) Bar graph
Bar graphs are graphs that display data as bars. They are suited to comparisons of quantity. The histogram of the 7 QC tools is one type of bar graph.
p. 87 · PDF 91
Source visual description
Original source visual. Selectable source labels and wording:
Original visual text
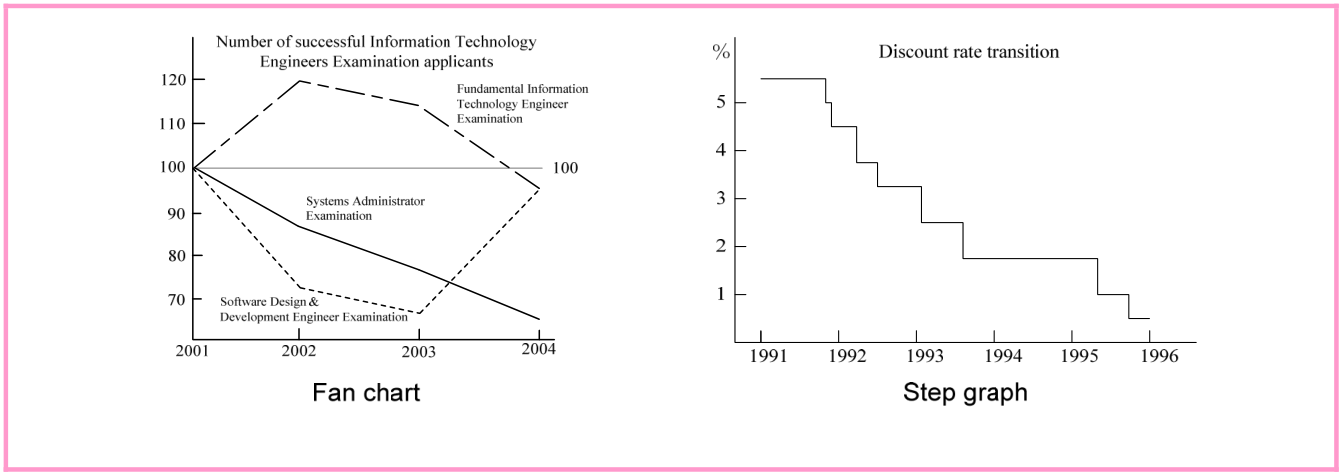
(3) Line graph
Line graphs are graphs that data is connected by lines. They are suited to displaying quantities that change over time. The area graph of the 7 QC tools is one type of line graph.
Source visual description
Original source visual. Selectable source labels and wording:
Original visual text
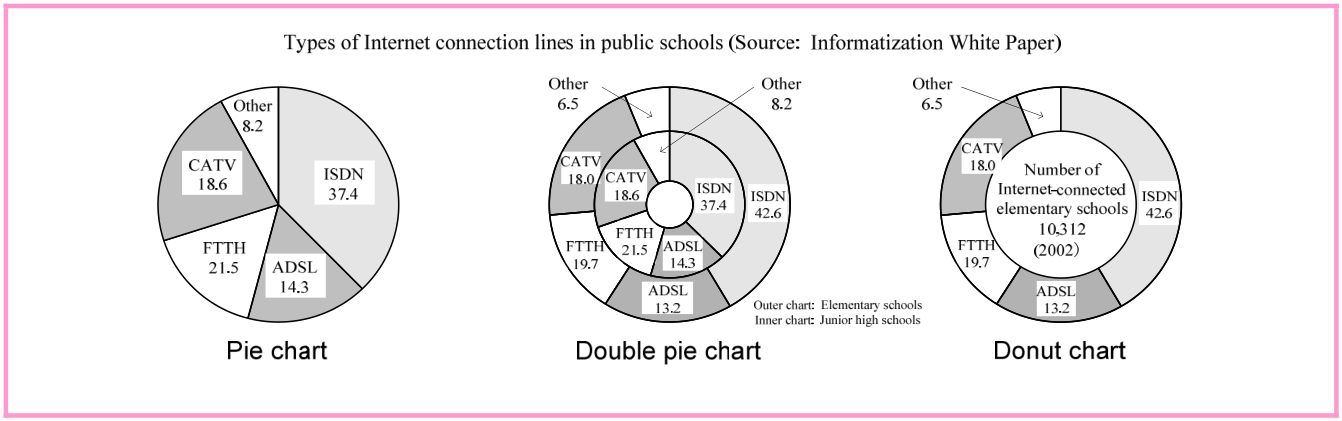
(4) Pie chart
Pie charts are graphs that represent the percentages of individual component elements against a total of 100%. They are suited to comparisons of the percentages of component elements.
p. 88 · PDF 92
Source visual description
Original source visual. Selectable source labels and wording:
Original visual text
(5) Chart
Chart is a general name for a diagram or graph that visually represents information. In general, a diagram that is created for a specific purpose is often called a chart.
- • Radar chart
This is a chart that sets a standard form for multiple evaluation items, plots ratios against those standards, and represents the balance among items by a polygonal shape connected with lines. For example, when food prices in Tokyo are set to 1 (i.e., 100%) for displaying food prices in New York on a radar chart, it allows an understanding of the variance (i.e., difference) in the balance. · 1 question - • Z chart (Z graph)
This is a chart that represents individual numeric values, their cumulative total, and the difference in compared cumulative values by using a line graph. For example, with sales volume by month at the base, each month’s cumulative sales can be represented with a line graph rising from left to right. In addition, for each month, total 1-year sales for the year up to and including that month can be shown on a line graph. This can be used to check the company’s sales record by seeing whether the line is rising or declining. · 1 question - • SD chart
This is a chart that is used to indicate impressions or feelings with respect to certain survey items. At both ends of multiple horizontal axes, the chart places antonyms of the characteristics to be evaluated, divides the evaluation of the degree of each characteristic into several levels, and connects the points that indicate the relevant degrees to depict a psychological state, an impression, and so on. - • Pie intersection chart
This is a chart that represents the mutual relationships among elements or items through the intersections of multiple circles, with each circle indicating one element or item. The overlapping portions of circles indicate elements or items that are shared between those circles.
p. 89 · PDF 93
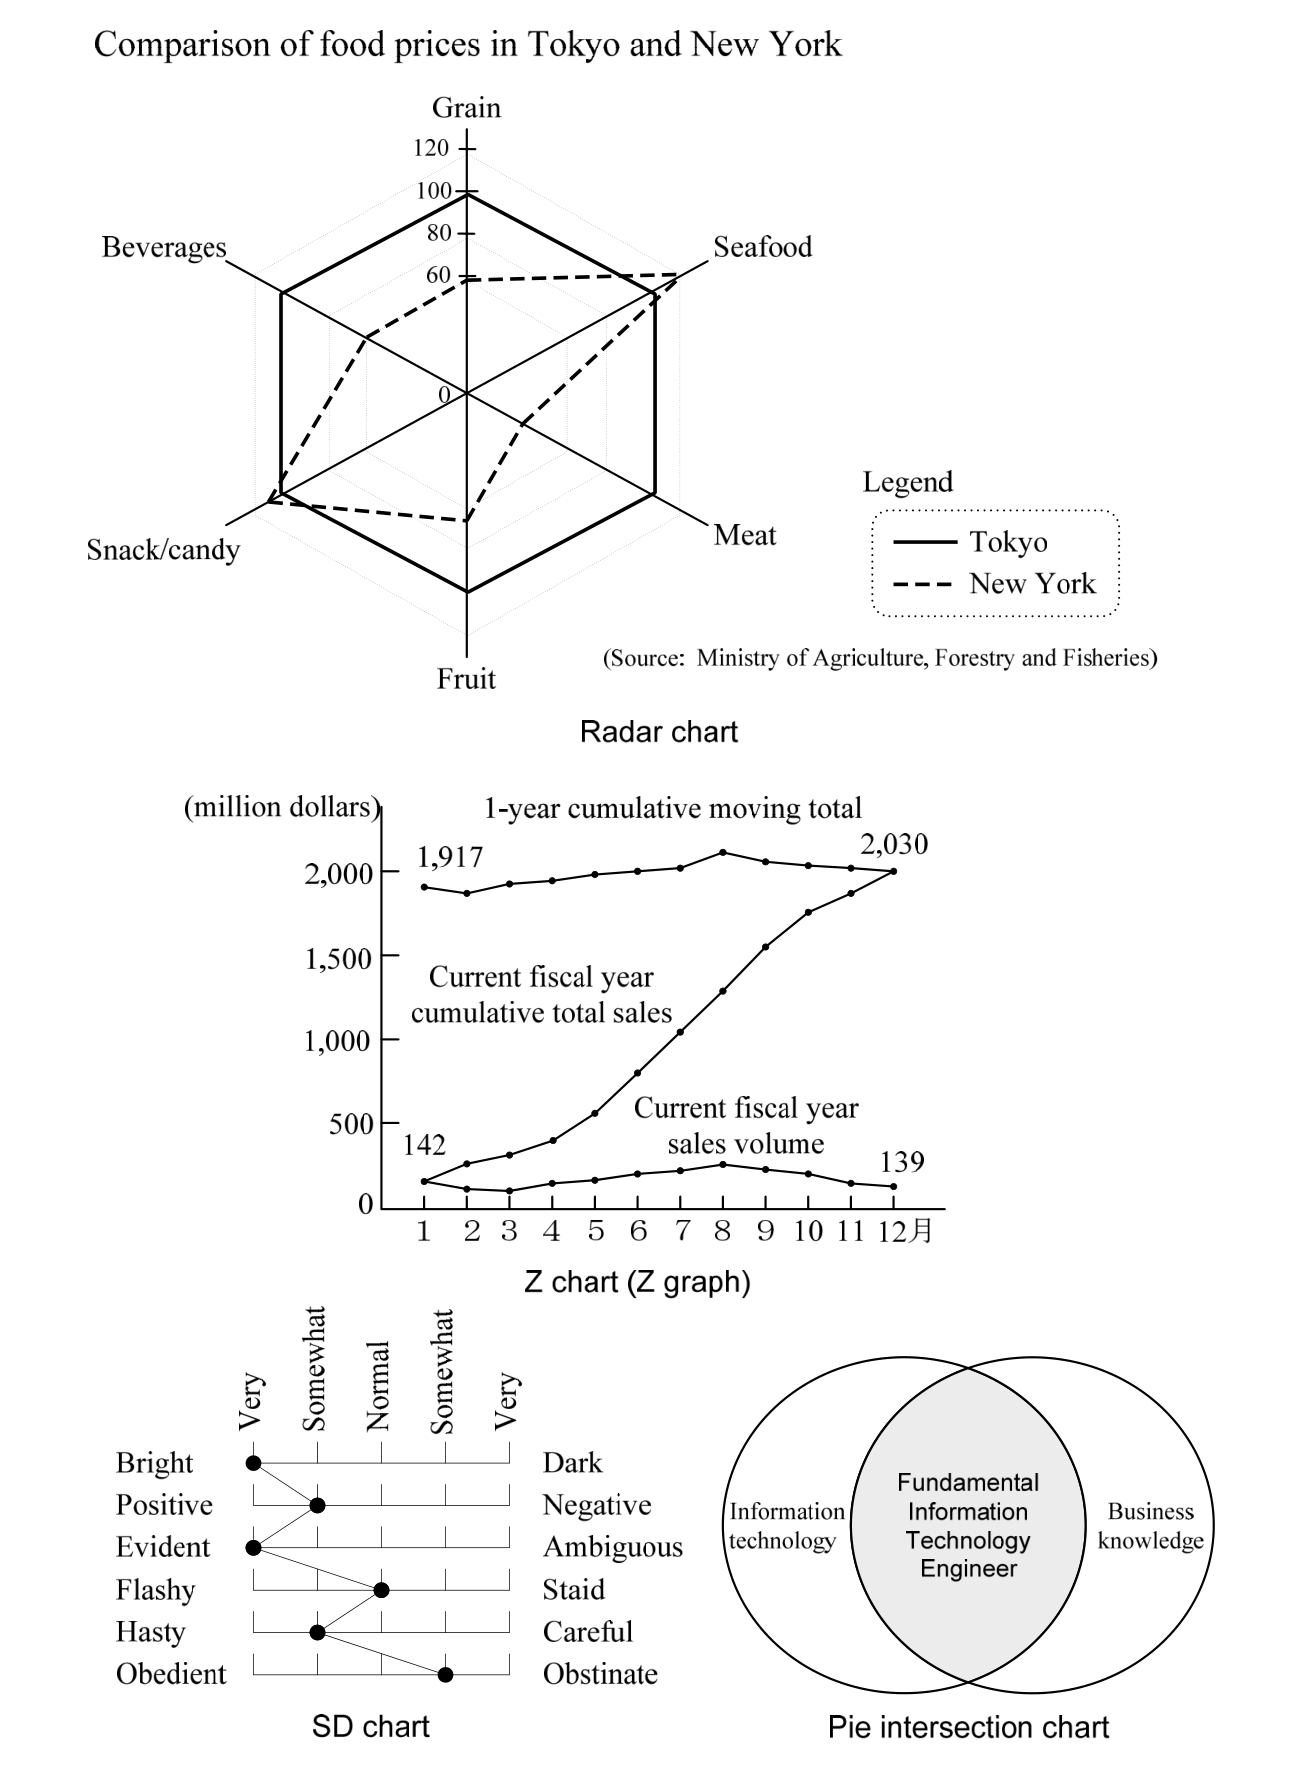
Source visual description
Original chart examples. The Radar chart compares food prices in Tokyo and New York and retains the original axes and source attribution. The Z chart retains its 1-year cumulative moving total and the current fiscal year sales/cumulative sales labels. The SD chart retains all paired adjective scales. The Pie intersection chart retains Information technology, Fundamental Information Technology Engineer and Business knowledge in the overlapping source circles. Original units, values, legends and captions remain together.
Original visual text
p. 90 · PDF 94
3-5-4 Data Analysis Techniques
Data analysis techniques are techniques that find data characteristics, law, regularity, and other properties by organizing collected information (or data) and analyzing the resulting data. The applied mathematics, OR, IE analysis techniques, and QC techniques which have been discussed so far can all be called data analysis techniques.
(1) ABC analysis (Pareto analysis)
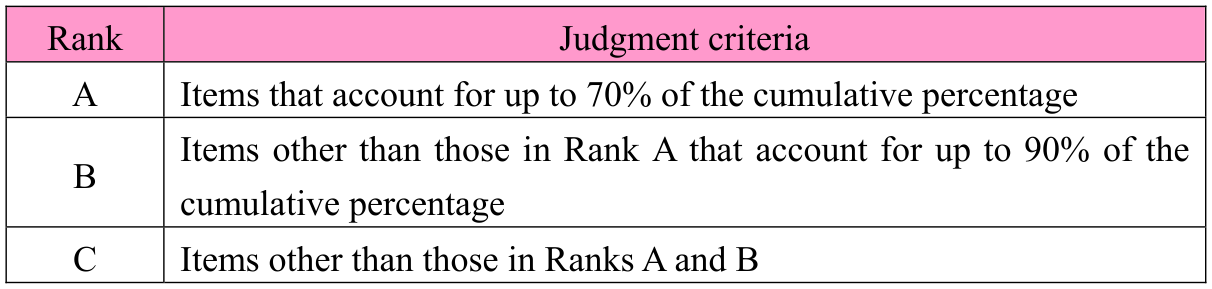
| Rank | Judgment criteria |
|---|---|
| A | Items that account for up to 70% of the cumulative percentage |
| B | Items other than those in Rank A that account for up to 90% of the cumulative percentage |
| C | Items other than those in Ranks A and B |
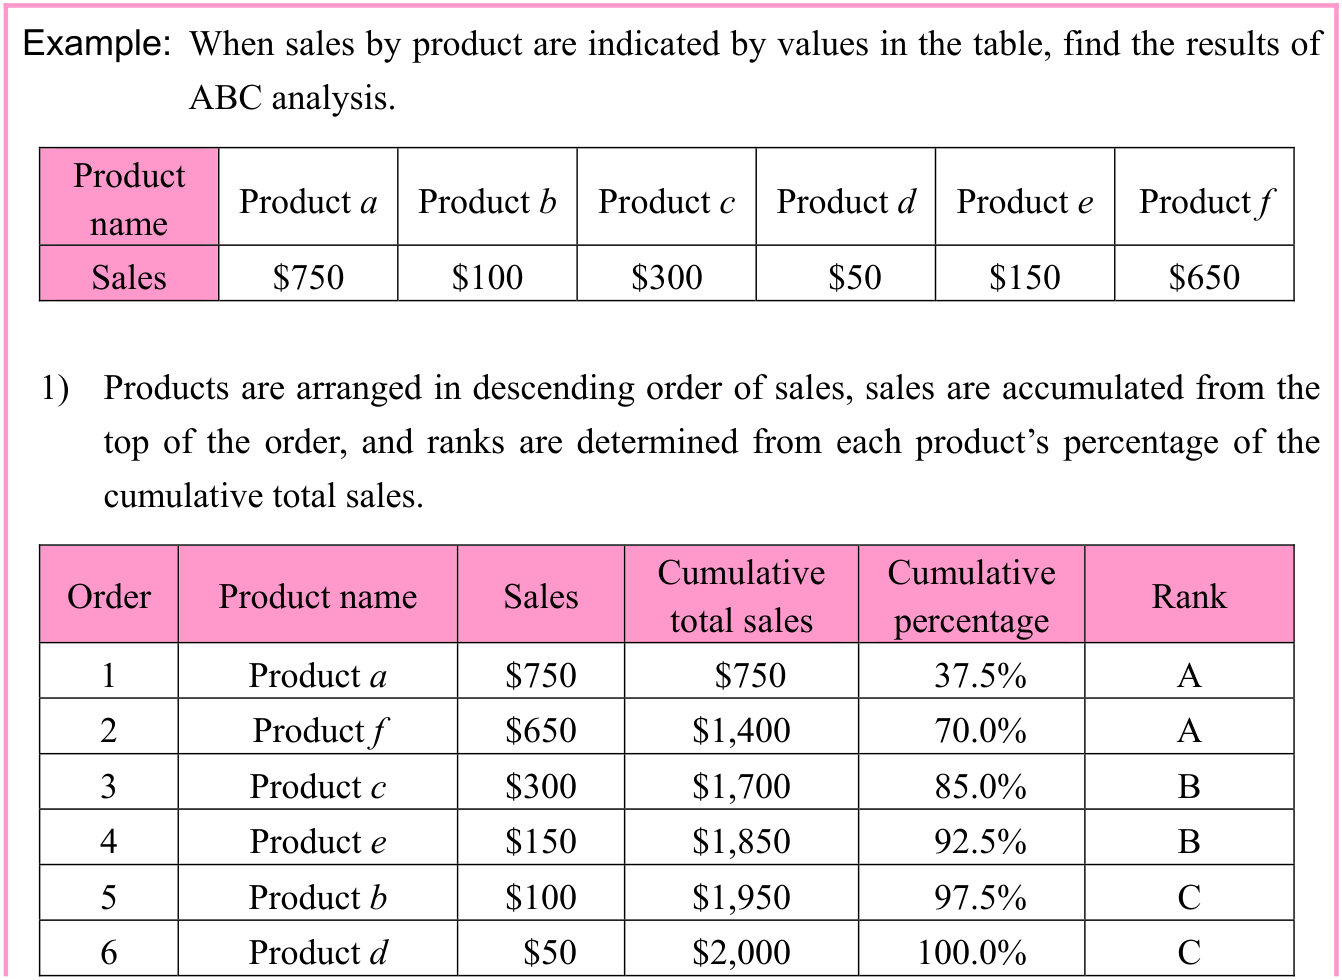
Source visual description
Original source visual. Selectable source labels and wording: Example: When sales by product are indicated by values in the table, find the results of ABC analysis. Product Product a Product b Product c Product d Product e Product f name Sales $750 $100 $300 $50 $150 $650 1) Products are arranged in descending order of sales, sales are accumulated from the top of the order, and ranks are determined from each product’s percentage of the cumulative total sales. Cumulative Cumulative Order Product name Sales Rank total sales percentage 1 Product a $750 $750 37.5% A 2 Product f $650 $1,400 70.0% A 3 Product c $300 $1,700 85.0% B 4 Product e $150 $1,850 92.5% B 5 Product b $100 $1,950 97.5% C 6 Product d $50 $2,000 100.0% C
Original visual text
Example: When sales by product are indicated by values in the table, find the results of ABC analysis. Product Product a Product b Product c Product d Product e Product f name Sales $750 $100 $300 $50 $150 $650 1) Products are arranged in descending order of sales, sales are accumulated from the top of the order, and ranks are determined from each product’s percentage of the cumulative total sales. Cumulative Cumulative Order Product name Sales Rank total sales percentage 1 Product a $750 $750 37.5% A 2 Product f $650 $1,400 70.0% A 3 Product c $300 $1,700 85.0% B 4 Product e $150 $1,850 92.5% B 5 Product b $100 $1,950 97.5% C 6 Product d $50 $2,000 100.0% C
p. 91 · PDF 95
Source visual description
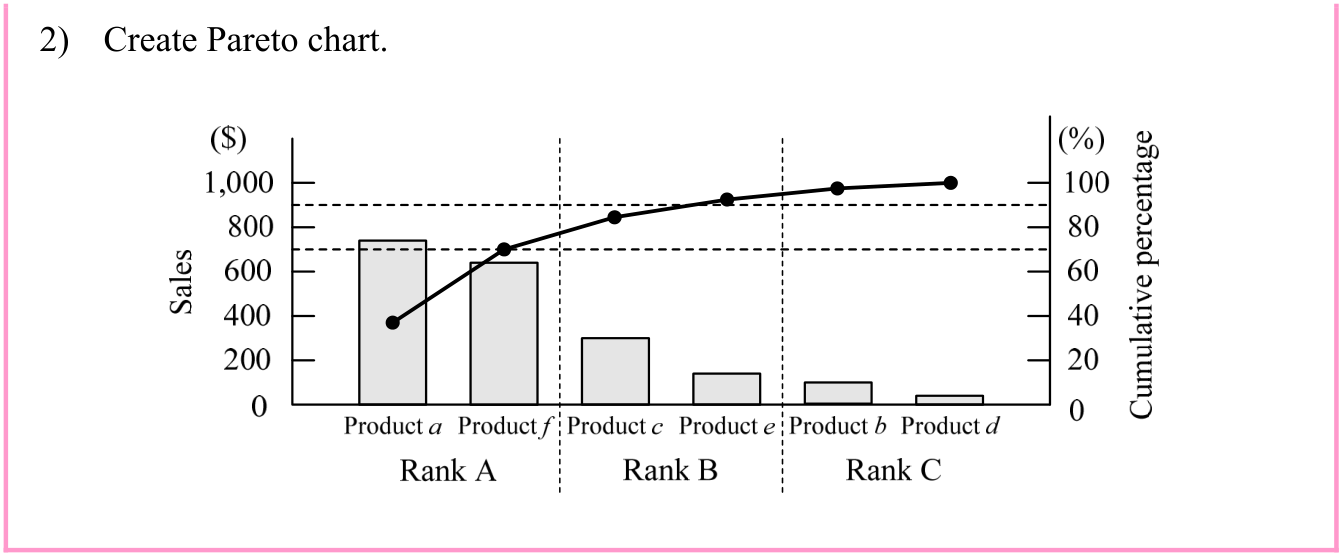
Original source visual. Selectable source labels and wording: 2) Create Pareto chart.
Original visual text
2) Create Pareto chart.
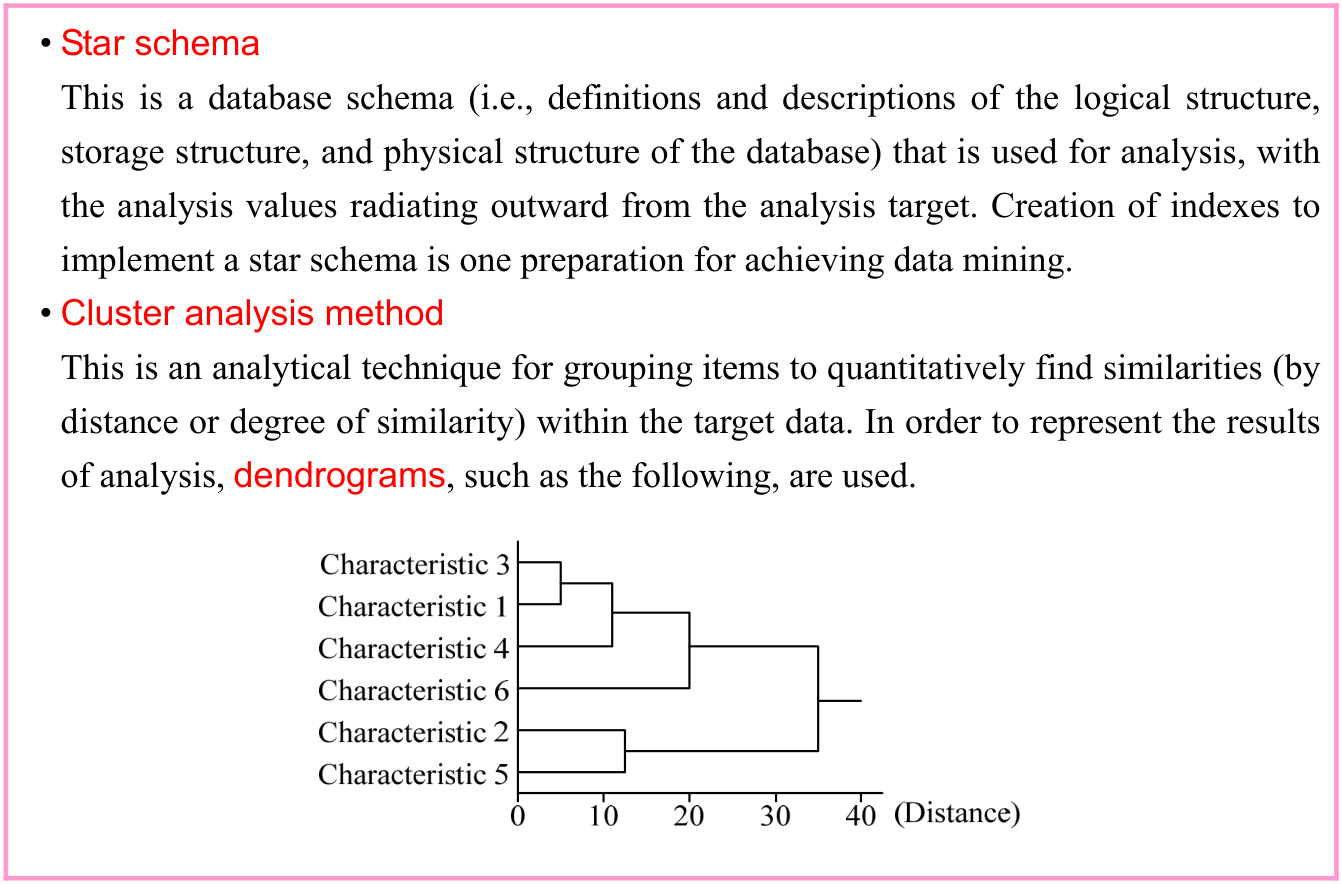
(2) Data mining
Source visual description
Original Star schema and Cluster analysis method callout, with its source dendrogram. The dendrogram rows are Characteristic 3, Characteristic 1, Characteristic 4, Characteristic 6, Characteristic 2 and Characteristic 5 from top to bottom. The original branching joins and Distance axis marked 0, 10, 20, 30 and 40 remain intact with the complete source definitions.
Original visual text
• Star schema This is a database schema (i.e., definitions and descriptions of the logical structure, storage structure, and physical structure of the database) that is used for analysis, with the analysis values radiating outward from the analysis target. Creation of indexes to implement a star schema is one preparation for achieving data mining. • Cluster analysis method This is an analytical technique for grouping items to quantitatively find similarities (by distance or degree of similarity) within the target data. In order to represent the results of analysis, dendrograms, such as the following, are used.
p. 92 · PDF 96
General data mining extracts data from mission critical systems and makes use of data warehouses, which are multidimensional databases that are constructed for information analysis. However, what is commonly used now is not only a single company’s data warehouses but also the large-scale data called big data. As per its name, big data is massive data on the scale of petabytes (PB, 1015 bytes) or exabytes (EB, 1018 bytes). It can include text, images, audio, and other forms of data. Big data is attracting attention as an information source that, through techniques such as data mining, can yield knowledge that was previously unobtainable. However, since the processing of big data can be difficult by using existing technology and software, its information may be provided by governments or specialized organizations that possess large-scale distributed processing systems or other environments for analyzing big data.
Section progress
Original chapter exercises
Original chapter exercises →New FE Textbook Vol.2 · First Edition, April 2015