Highlighted text? Practice this concept. Highlighted passages and figures open related questions.
Practice related questions (1)Progress & bookmarks
Current section
3-1-6 Queueing Theory
p. 53
Practice this section 1 linked exam question with default filters
Progress
Not marked complete
Related questions in this lesson 2
Queueing theory2p. 53 · PDF 57
3-1-6 Queueing Theory
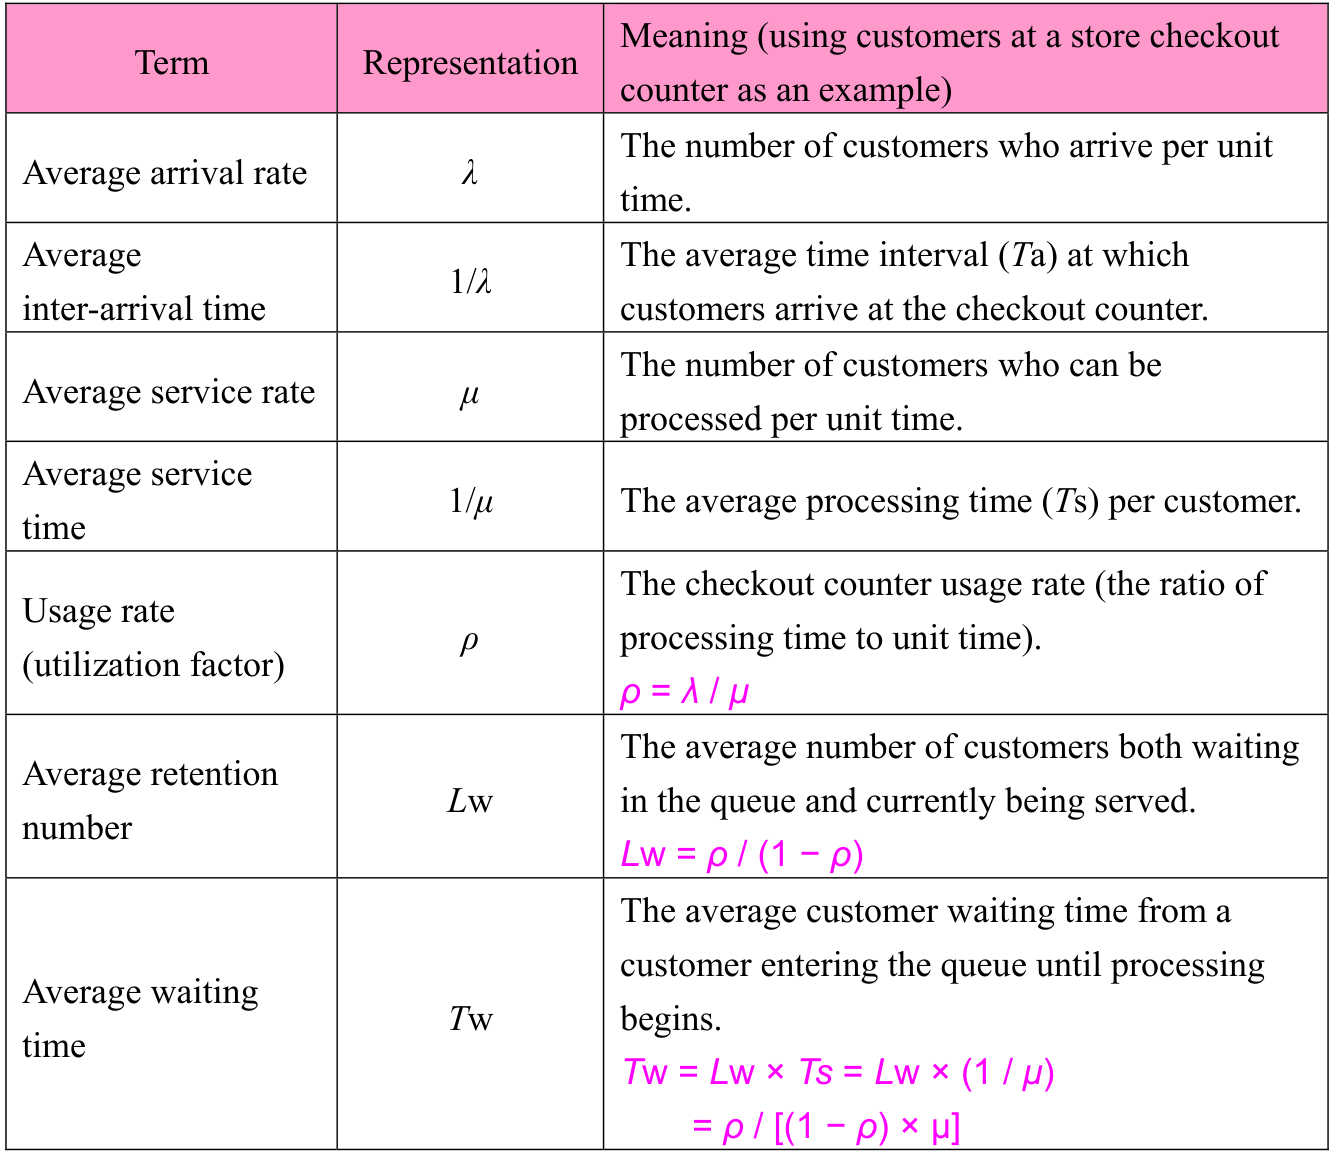
| Term | Representation | Meaning (using customers at a store checkout counter as an example) |
|---|---|---|
| Average arrival rate | λ | The number of customers who arrive per unit time. |
| Average inter-arrival time | 1/λ | The average time interval (Ta) at which customers arrive at the checkout counter. |
| Average service rate | μ | The number of customers who can be processed per unit time. |
| Average service time | 1/μ | The average processing time (Ts) per customer. |
| Usage rate (utilization factor) | ρ | The checkout counter usage rate (the ratio of processing time to unit time). ρ = λ / μ |
| Average retention number | Lw | The average number of customers both waiting in the queue and currently being served. Lw = ρ / (1 − ρ) |
| Average waiting time | Tw | The average customer waiting time from a customer entering the queue until processing begins. Tw = Lw × Ts = Lw × (1 / μ) = ρ / [(1 − ρ) × μ] |
p. 54 · PDF 58
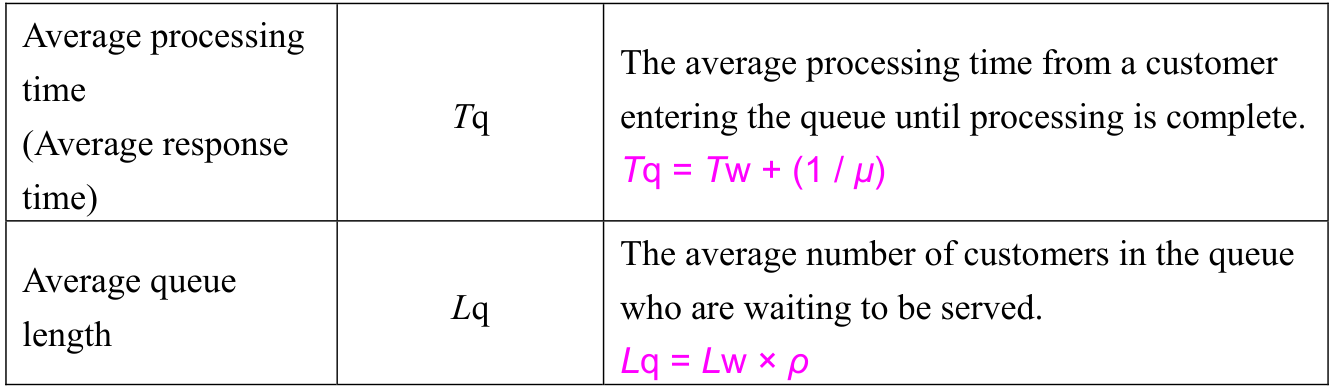
| Average processing time (Average response time) | Tq | The average processing time from a customer entering the queue until processing is complete. Tq = Tw + (1 / μ) |
|---|---|---|
| Average queue length | Lq | The average number of customers in the queue who are waiting to be served. Lq = Lw × ρ |
Source visual description
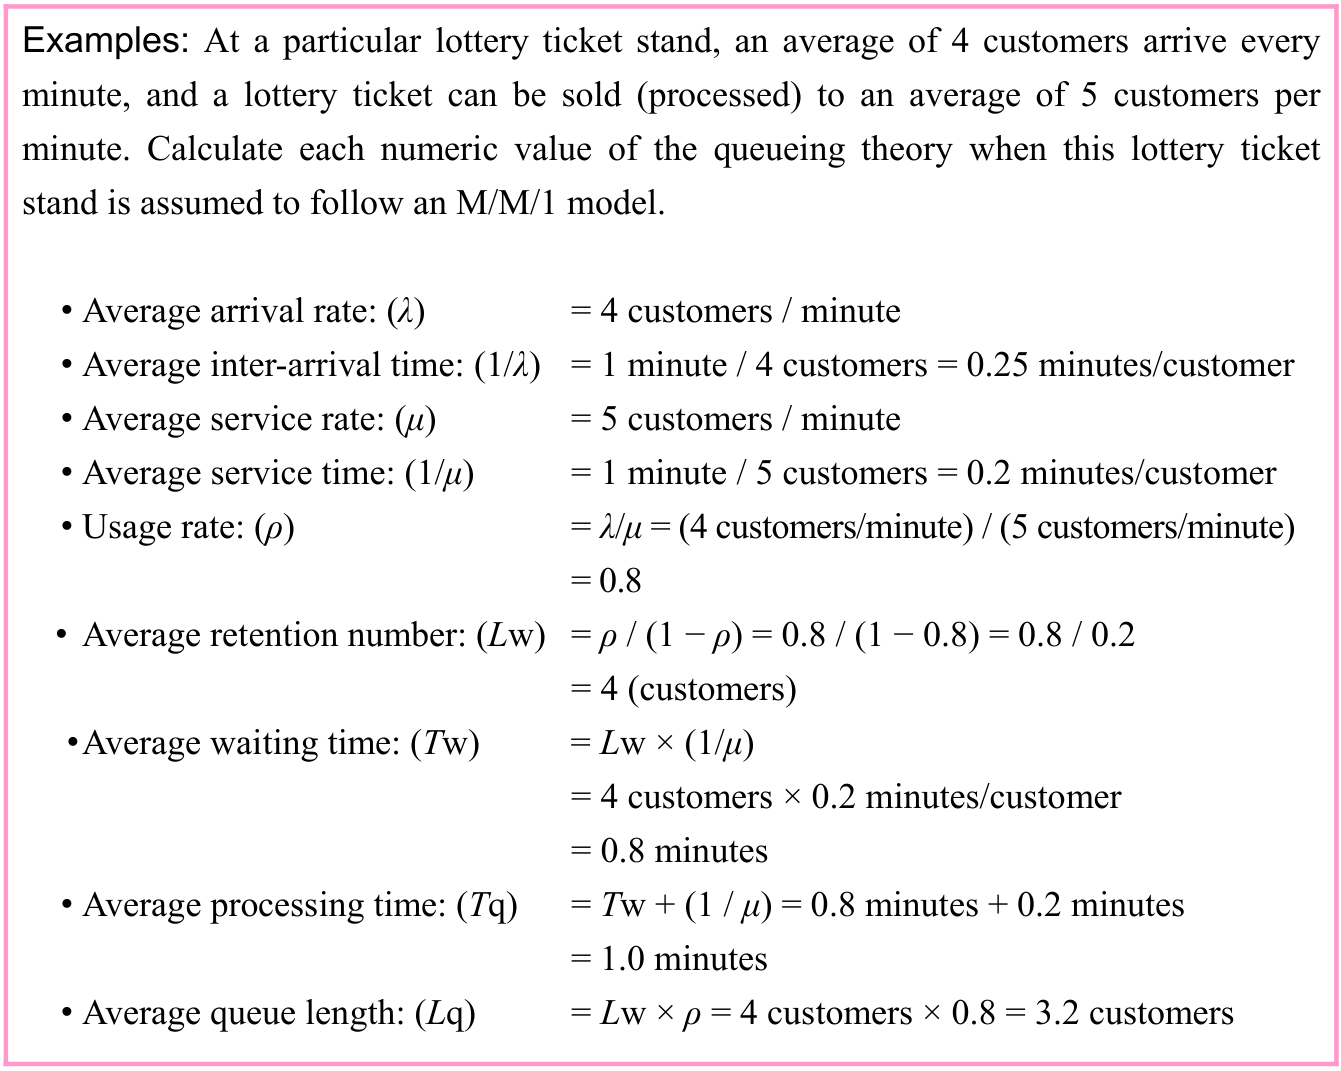
The original lottery-ticket example has arrival rate 4 customers per minute and service rate 5 customers per minute. Its displayed results are inter-arrival time 0.25 minutes/customer, service time 0.2 minutes/customer, usage 0.8, retention number 4 customers, waiting time 0.8 minutes, processing time 1.0 minutes and queue length 3.2 customers. Source variable names Lw, Tw, Tq and Lq and the original formulas are retained.
Selectable source glyphs (PDF extraction order)
Examples: At a particular lottery ticket stand, an average of 4 customers arrive every minute, and a lottery ticket can be sold (processed) to an average of 5 customers per minute. Calculate each numeric value of the queueing theory when this lottery ticket stand is assumed to follow an M/M/1 model. • Average arrival rate: (λ) = 4 customers / minute • Average inter-arrival time: (1/λ) = 1 minute / 4 customers = 0.25 minutes/customer • Average service rate: (μ) = 5 customers / minute • Average service time: (1/μ) = 1 minute / 5 customers = 0.2 minutes/customer • Usage rate: (ρ) = λ/μ = (4 customers/minute) / (5 customers/minute) = 0.8 • Average retention number: (Lw) = ρ / (1 − ρ) = 0.8 / (1 − 0.8) = 0.8 / 0.2 = 4 (customers) • Average waiting time: (Tw) = Lw × (1/μ) = 4 customers × 0.2 minutes/customer = 0.8 minutes • Average processing time: (Tq) = Tw + (1 / μ) = 0.8 minutes + 0.2 minutes = 1.0 minutes • Average queue length: (Lq) = Lw × ρ = 4 customers × 0.8 = 3.2 customers
Section progress
Original chapter exercises
Original chapter exercises →New FE Textbook Vol.2 · First Edition, April 2015