Contents
Chapter 2 · Information Processing SystemPractice

LEARN WITH HARU

Video Lesson တွေက Haru အတန်းသားတွေအတွက်ပါ

Haru ရဲ့ ITPEC FE Full Course မှာ ယခု သင်ခန်းစာတွေကို တစ်ခုချင်း တစ်ကြောင်းချင်း အသေးစိတ်ရှင််ရှင်းပြထားပါတယ်

အခြေခံ မရှိတဲ့ ကျောင်းသားများစွာဟာလည်း ဒီ Course နဲ့ ပဲ အောင်မြင်ကုန်ကြပါပြီ

အတန်းမအပ်သေးပဲ Haru ဆီမှာ အစမ်းသင်ကြည့်ချင်ပါသလား?

သင်တန်းသားတွေရဲ့ စကားသံများ

သင်တန်းသားတွေရဲ့ စကားသံများ

Highlighted text? Practice this concept. Highlighted passages and figures open related questions.

Practice related questions (8)Progress & bookmarks

Current section

3-2 Evaluation of Reliability

p. 143

Practice this section 8 linked exam questions with default filters

Progress

Not marked complete

Related questions in this lesson 12

RASIS availability1Series and parallel system availability4Foolproof design1Allowed downtime from availability1Fail-safe design1Mean time between failures2Fail-soft operation with restricted functions1Availability of parallel redundant devices1
Progress and bookmarks

p. 143

3 - 2 Evaluation of Reliability

3-2-1 Concept of Reliability

Various information processing systems are operated in a modern society. Conversely, it can be said that a modern society cannot be set up without an information processing system. It is but obvious that an information processing system playing such an important role is required to have high reliability. The concepts for constructing a highly reliable system are classified as shown below.

(1) Concept of a fault

(a) Fault tolerant (fault tolerant technique) This is a concept of creating a mechanism for minimizing the effect of a fault on the basis of the assumption that a fault will definitely occur in a device or system created by a human. A system that is constructed on the basis of this concept is called a fault tolerant system.

(b) Fault avoidance (fault avoidance technique) This is a concept that a fault is not allowed to occur in a system at any cost. Since in reality it is not possible to prevent a fault from occurring, it can be referred to as a concept (or technique) that the possibility of the occurrence of a fault is brought as close to zero as possible.

(2) Concept of safety

(a) Fail-safe This is a concept of stopping the system in order to avoid the impact of the occurrence of a failure on other parts by giving priority to safety. An example of this · 1 question

p. 144

concept is the control system of a traffic signal. When a failure occurs, all signals are turned to red to prevent accidents.

(b) Foolproof This is a concept of preventing an operator from making a mistake so that the mistake of the person operating the system does not affect the overall system. Examples of this concept include washing machines that do not operate unless the lid is closed and the checking and correction of input data for any mistakes. · 1 question

3-2-2 Index of Reliability

There are indexes and indicators that evaluate such as the reliability of an information processing system. This set of indexes and indicators is called RASIS which is obtained by arranging together the first letter of the following five items. It is also called RAS which is obtained by arranging together the first letter of the top three items.
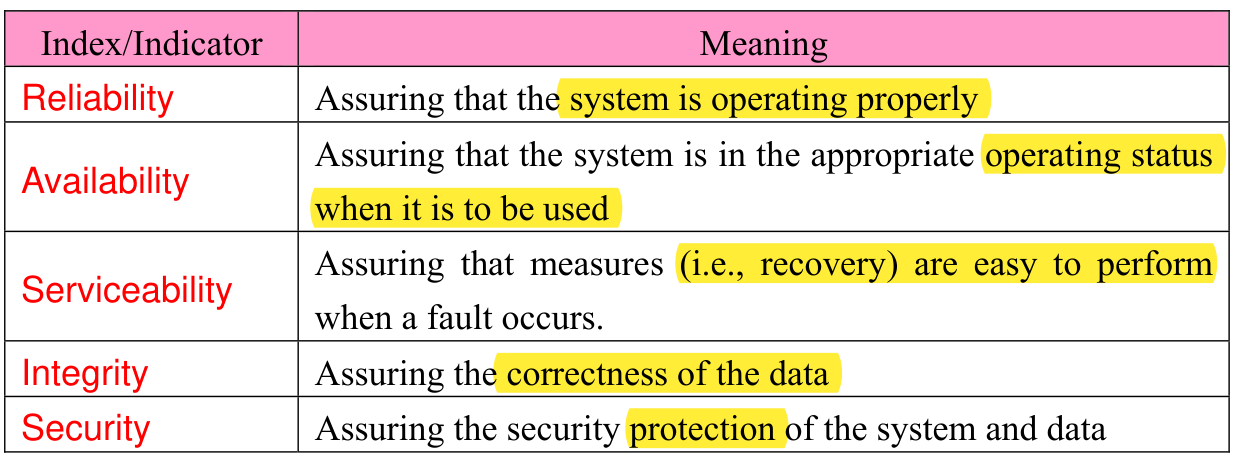
Original two-column RASIS table. Reliability: system operates properly. Availability: appropriate operating status when needed. Serviceability: recovery measures are easy when a fault occurs. Integrity: correctness of data. Security: protection of system and data. Original row alignment and highlighted words remain intact.
p. 144 · Enlarge
RASIS availability · 1 practice questions

Among these five indexes and indicators, R (Reliability), A (Availability), and S (Serviceability) are evaluated by using the scale shown below.

(1) MTBF (Mean Time Between Failures) This is the mean operation time from the recovery of the system (or device) from a failure until the occurrence of the next failure. It is used to represent R (i.e., Reliability). (2) MTTR (Mean Time To Repair) This is the mean time from the occurrence of a failure in the system (or device) until its recovery. It is used to represent S (i.e., Serviceability). (3) Availability This is the probability of the normal operation of the system (or device) and is used to represent A (i.e., Availability). Availability indicates the ratio of normal operation of the system per unit time and can be calculated using MTBF and MTTR as shown · 2 questions

p. 145

below.

Original stacked fraction: Availability equals MTBF divided by MTBF plus MTTR. The denominator groups MTBF and MTTR together.
p. 145 · Enlarge

The probability that the system (or device) is not operating with respect to the probability that the system (or device) is operating (availability) is called non-availability. Non-availability indicates the ratio of the system failure per unit time and can be calculated as shown below.

Original boxed expression: Non-availability equals one minus Availability, equals MTTR divided by the sum MTBF plus MTTR.
p. 145 · Enlarge
Allowed downtime from availability · 1 practice questions
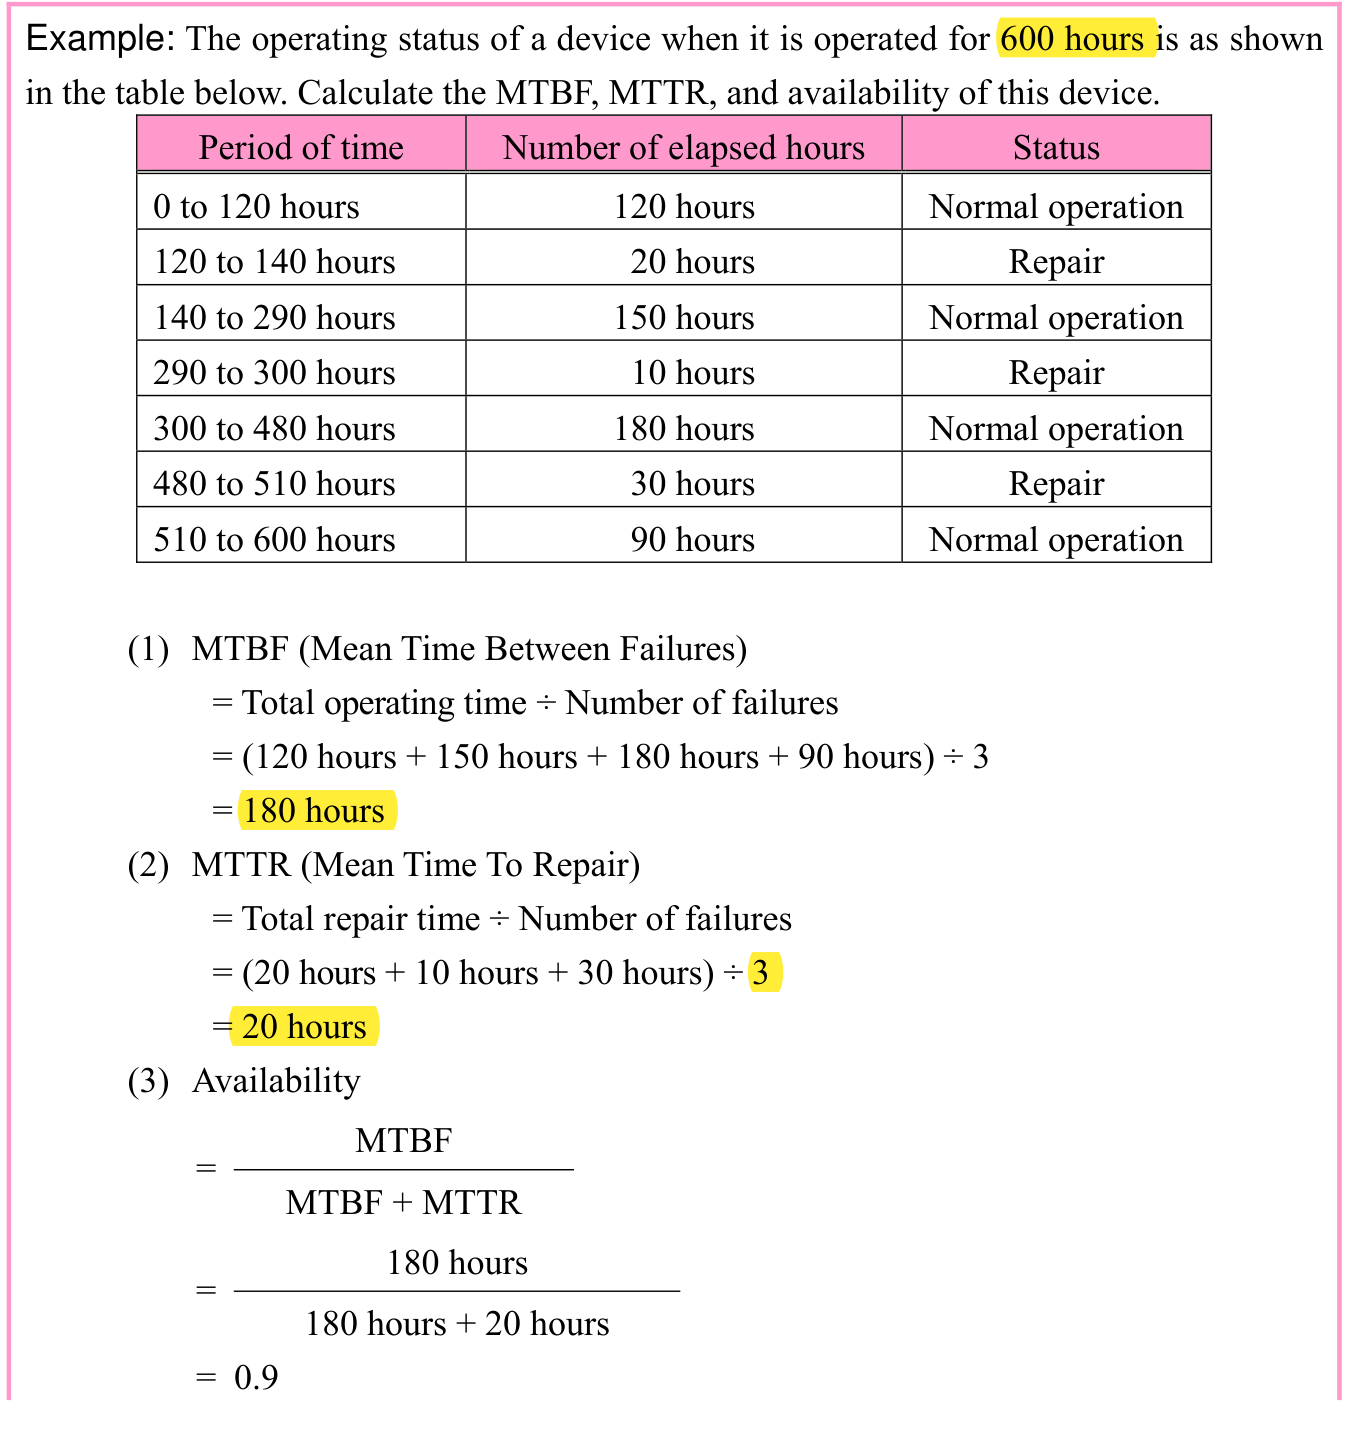
Original 600-hour example, question, three-column table and complete calculation. Intervals 0–120,120–140,140–290,290–300,300–480,480–510,510–600 have durations 120,20,150,10,180,30,90 hours; alternating normal operation and repair. MTBF=(120+150+180+90)/3=180 hours. MTTR=(20+10+30)/3=20 hours. Availability=180/(180+20)=0.9. The following page continues with the original Figure A/B illustration.
p. 145 · Enlarge

p. 146

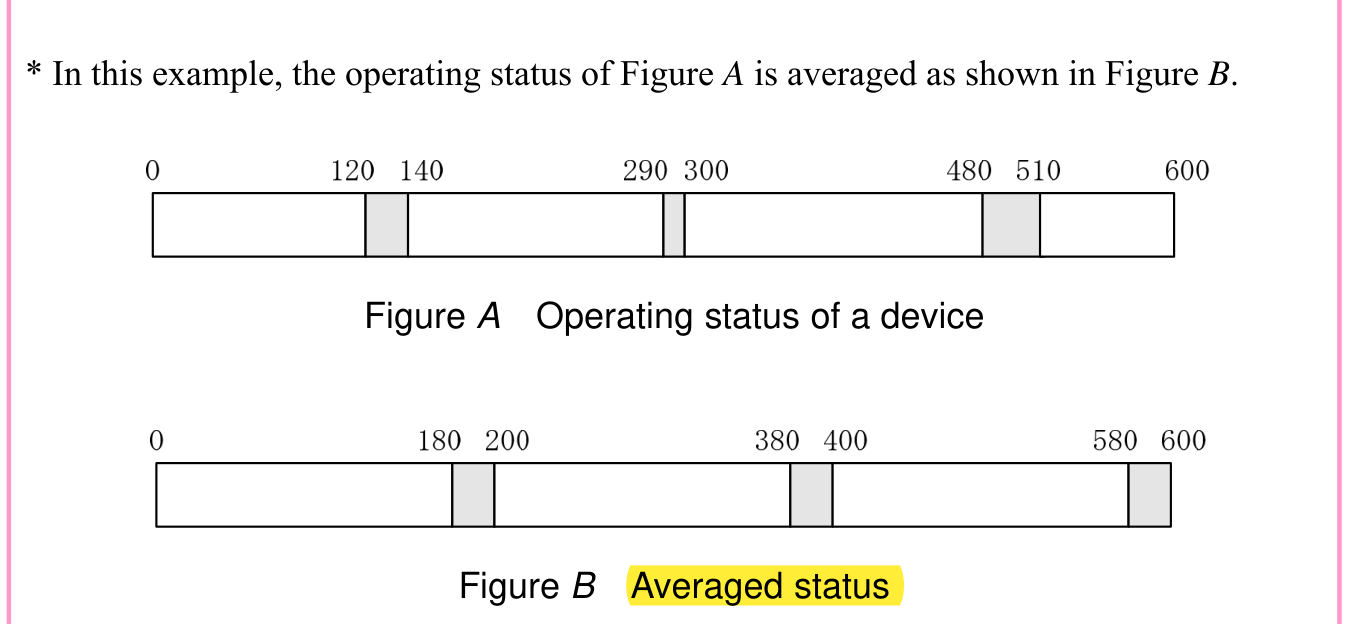
Original continuation of the 600-hour example. Figure A shows operating/repair transitions at hours 0,120,140,290,300,480,510,600. Figure B averages these into transitions at 0,180,200,380,400,580,600. The note states that Figure A is averaged into Figure B. Both timelines and their captions remain together.
p. 146 · Enlarge

3-2-3 Availability and Failure Rate of the System

Generally, a system is configured by several devices. At this time, the availability of the overall system can be calculated from the availability of each device.

(1) Availability of a series system

In the case of a series system, the system operates normally as a whole only when all devices are operating. In the case of a series system shown in Figure 2-10, the operating status of each device is summarized as shown in the table below.
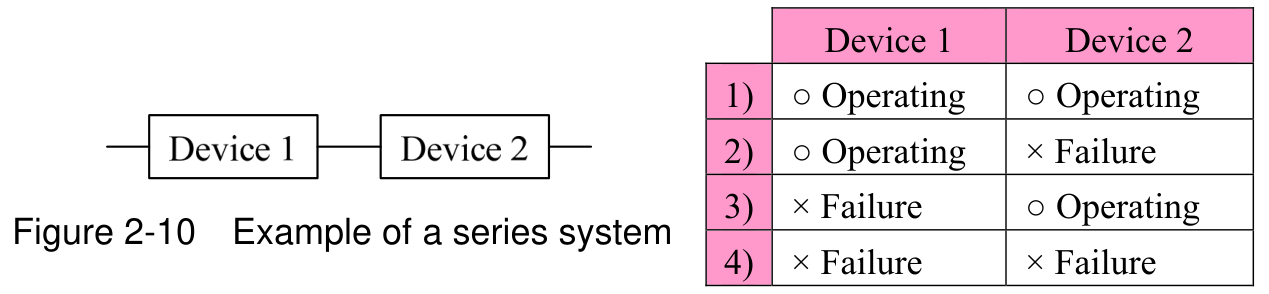
Original Figure 2-10, Example of a series system, and adjacent two-device state table. Devices 1 and 2 are connected in series. Rows 1–4 are operating/operating, operating/failure, failure/operating, failure/failure. Only row 1 operates as a complete series system. Original circles and crosses remain intact.
p. 146 · Enlarge

According to this table, the system operates as a whole only in the case of 1) when both devices are in the operating status. Therefore, the availability of a series system is calculated by the expression below.

Original boxed formula: availability of a series system equals availability of device 1 multiplied by availability of device 2.
p. 146 · Enlarge

Similarly, even if the number of devices is increased to three or four, the series system operates normally only when all devices are operating. Therefore, the availability of the series system is calculated as the result obtained by multiplying the availability of all devices that make up the

p. 147

system.

Original complete formula box: availability of n devices connected in series is the product of availability of device 1, device 2, through device n. The italic n and multiplication signs remain in the original layout.
p. 147 · Enlarge

Since the availability is less than 1, the value keeps getting smaller with each repeated multiplication. That is, the higher the number of devices connected in a series system, the lower the availability becomes.
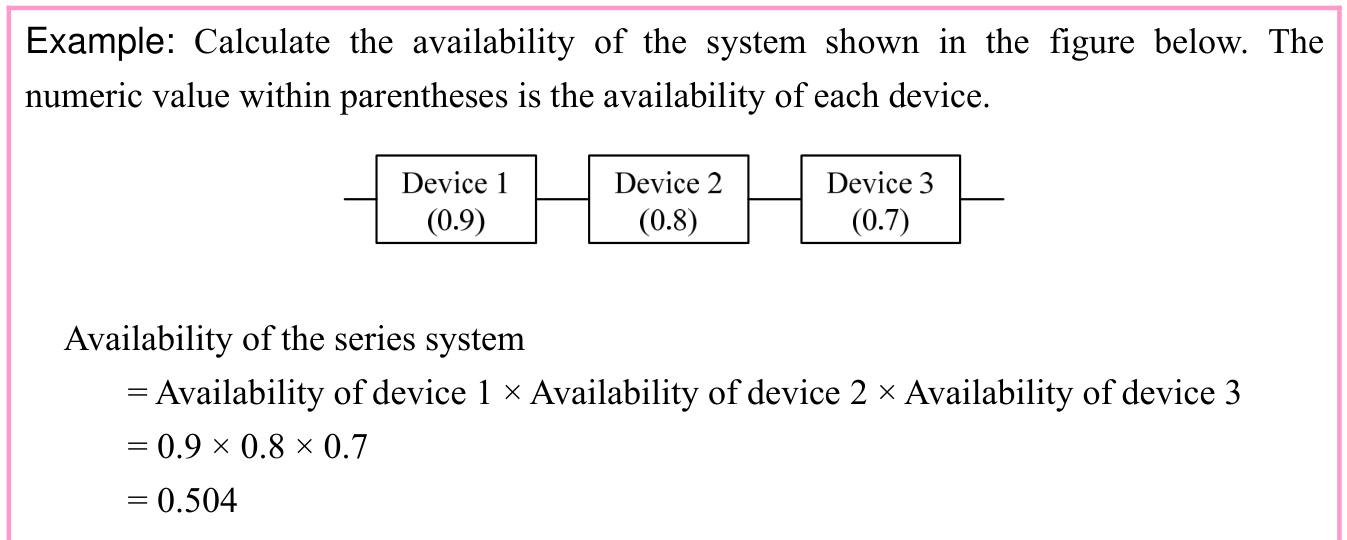
Original complete series-system example. Three devices in sequence have availabilities 0.9,0.8,0.7. The displayed product 0.9×0.8×0.7 gives 0.504. Question, circuit and all calculation lines remain together.
p. 147 · Enlarge

(2) Availability of a parallel system

In the case of a parallel system, the system may operate as a whole even when not all devices are operating. In the case of a parallel system shown in Figure 2-11, the operating status of each device is summarized as shown in the table below.
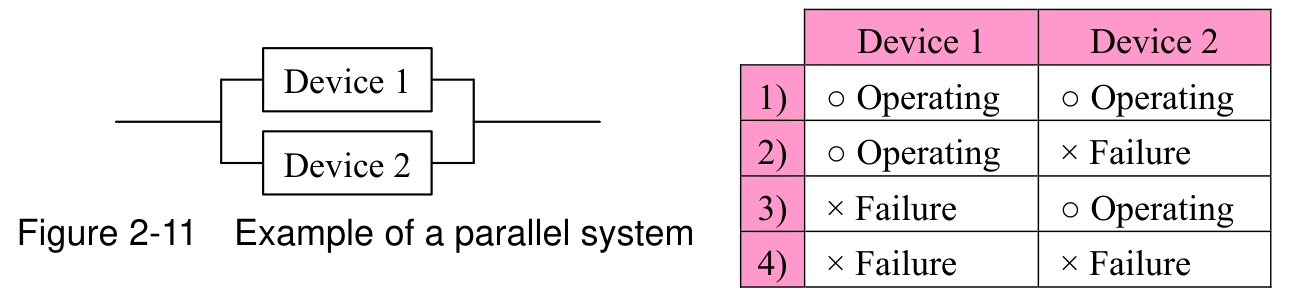
Original Figure 2-11, Example of a parallel system, and adjacent two-device state table. Devices 1 and 2 form parallel branches. Rows 1–4 are operating/operating, operating/failure, failure/operating, failure/failure. Rows 1 through 3 operate; row 4 fails. Diagram connectors, caption and circles/crosses remain intact.
p. 147 · Enlarge

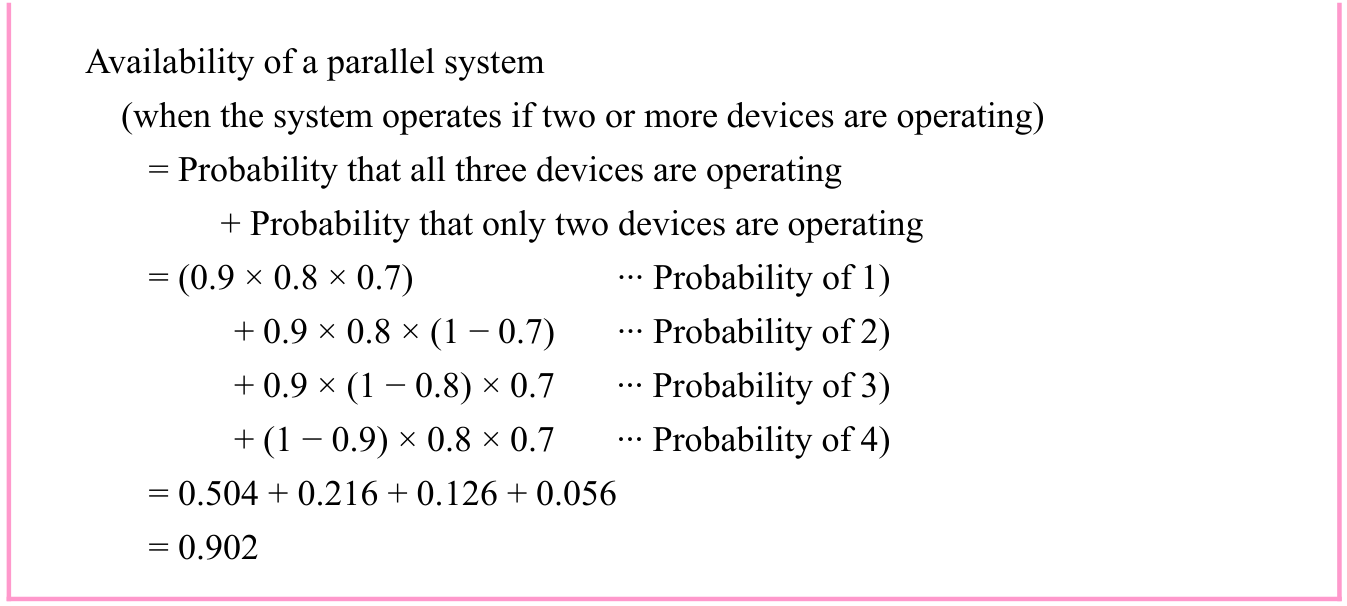
At this time, the functionality of the system is conserved (or the system operates as a whole) even if only either of the two devices is operating, and thus, the system operates as a whole in the case of 1) through 3). Thus, the availability of the overall system can be calculated by adding up the probability of 1) through 3). However, since in this way the calculation becomes tedious, it is assumed that among all operating conditions, the system is in a non-operating status only in the case of 4), and the total probability of 1) through 3) is calculated by subtracting the probability of

  • 4) from the total probability “1” of all operating conditions. Therefore, the availability of a parallel

p. 148

system is calculated by the expression shown below.

Original formula box: parallel availability equals 1 minus non-availability of device 1 times non-availability of device 2, hence 1−(1−availability of device 1)×(1−availability of device 2). Parentheses and both lines remain intact.
p. 148 · Enlarge

Similarly, as shown in Figure 2-12, consider a case in which three or more devices are connected in parallel.
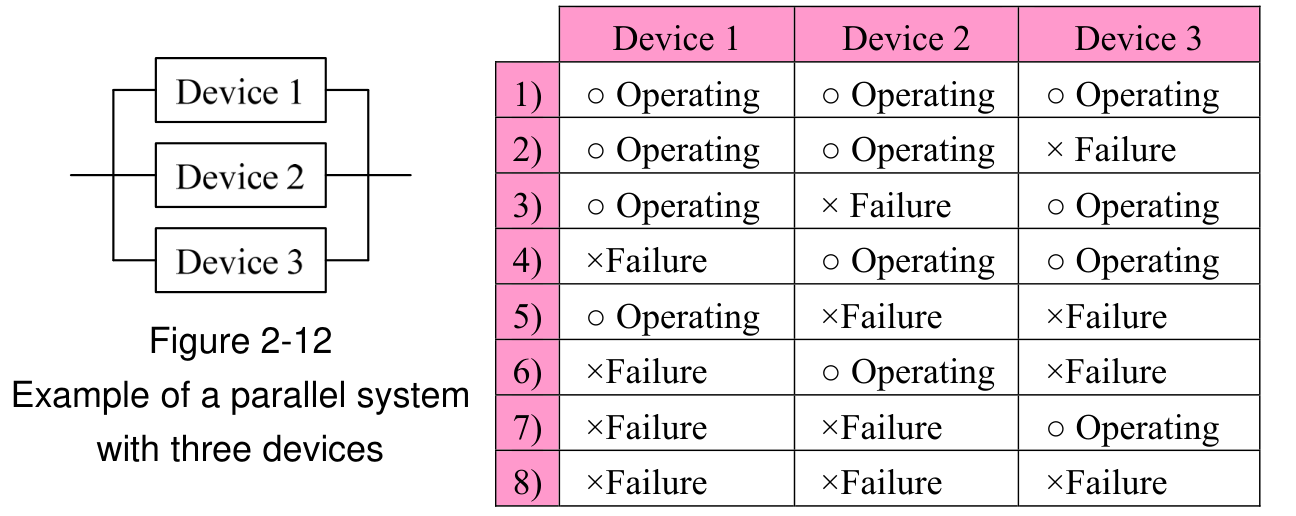
Original Figure 2-12, parallel system with three devices, and complete eight-row state table. Device states by row: OOO,OOF,OFO,FOO,OFF,FOF,FFO,FFF, where O is original operating circle and F is failure cross. All three branches, rows and multiline caption remain intact.
p. 148 · Enlarge

In this case, the following combinations can be assumed in consideration of the minimum number of devices with which the system operates normally as a whole.
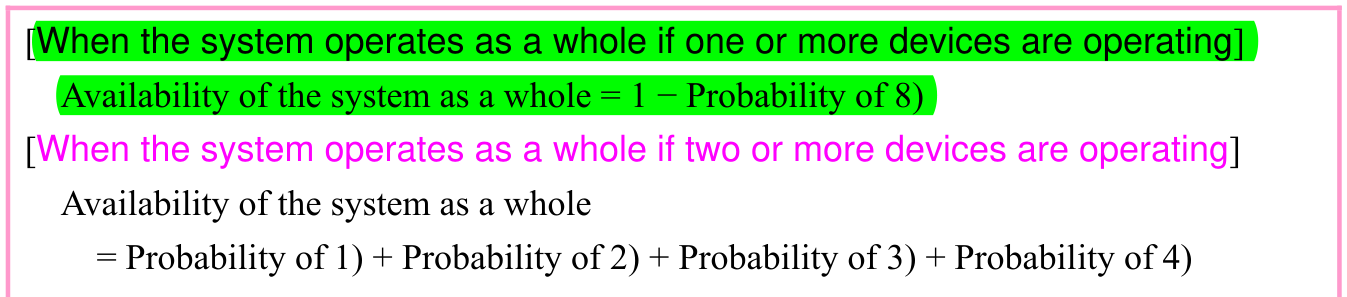
Original complete threshold formulas. If one or more devices operate: whole-system availability=1−probability of row 8. If two or more operate: availability equals probabilities of rows 1+2+3+4. Both original headings and aligned expressions are retained.
p. 148 · Enlarge

In a parallel system, the more devices you connect, the higher the availability becomes.
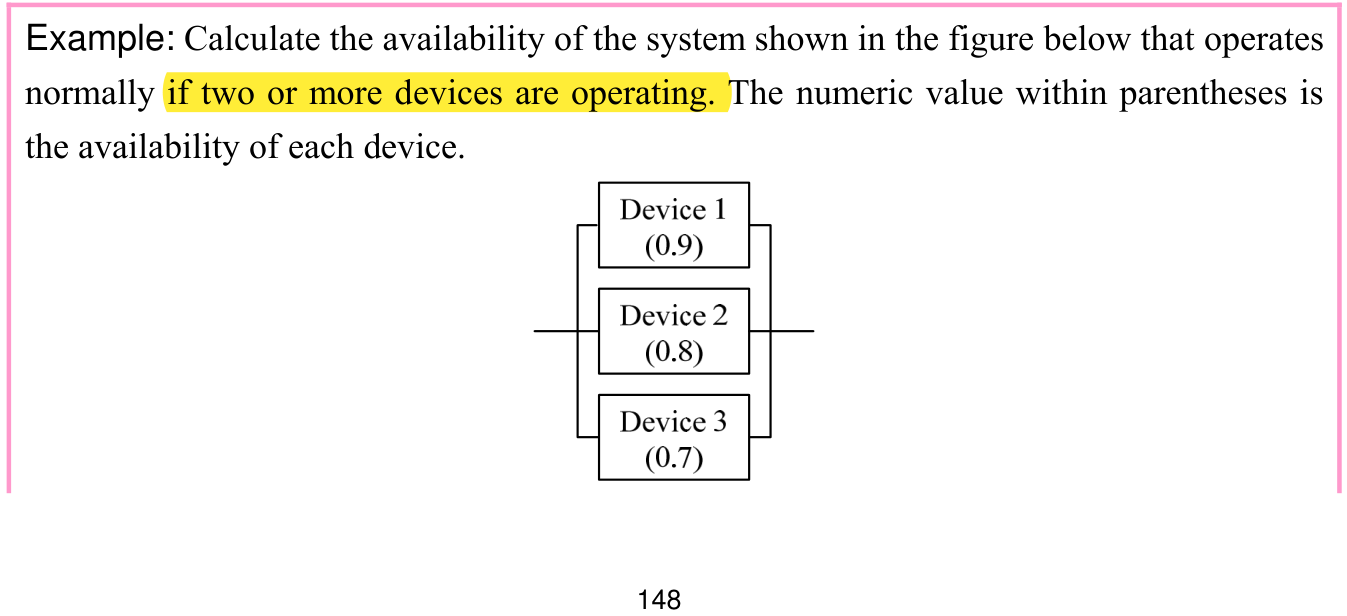
Original two-of-three example, first page. Question requires at least two devices operating. Three parallel branches are labeled device 1 (0.9), device 2 (0.8), device 3 (0.7). The full question and diagram continue to the next page's complete solution.
p. 148 · Enlarge

p. 149

Original continuation and complete two-of-three solution. Availability is probability of all three operating plus exactly two operating: 0.9×0.8×0.7 +0.9×0.8×(1−0.7)+0.9×(1−0.8)×0.7+(1−0.9)×0.8×0.7 =0.504+0.216+0.126+0.056=0.902. Row-probability annotations remain aligned.
p. 149 · Enlarge
Availability of parallel redundant devices · 1 practice questions

(3) Availability of a series/parallel mixed system

The availability of a system in which both a series system and a parallel system are mixed is calculated on a part-by-part basis, and then the availability of the overall system is calculated.
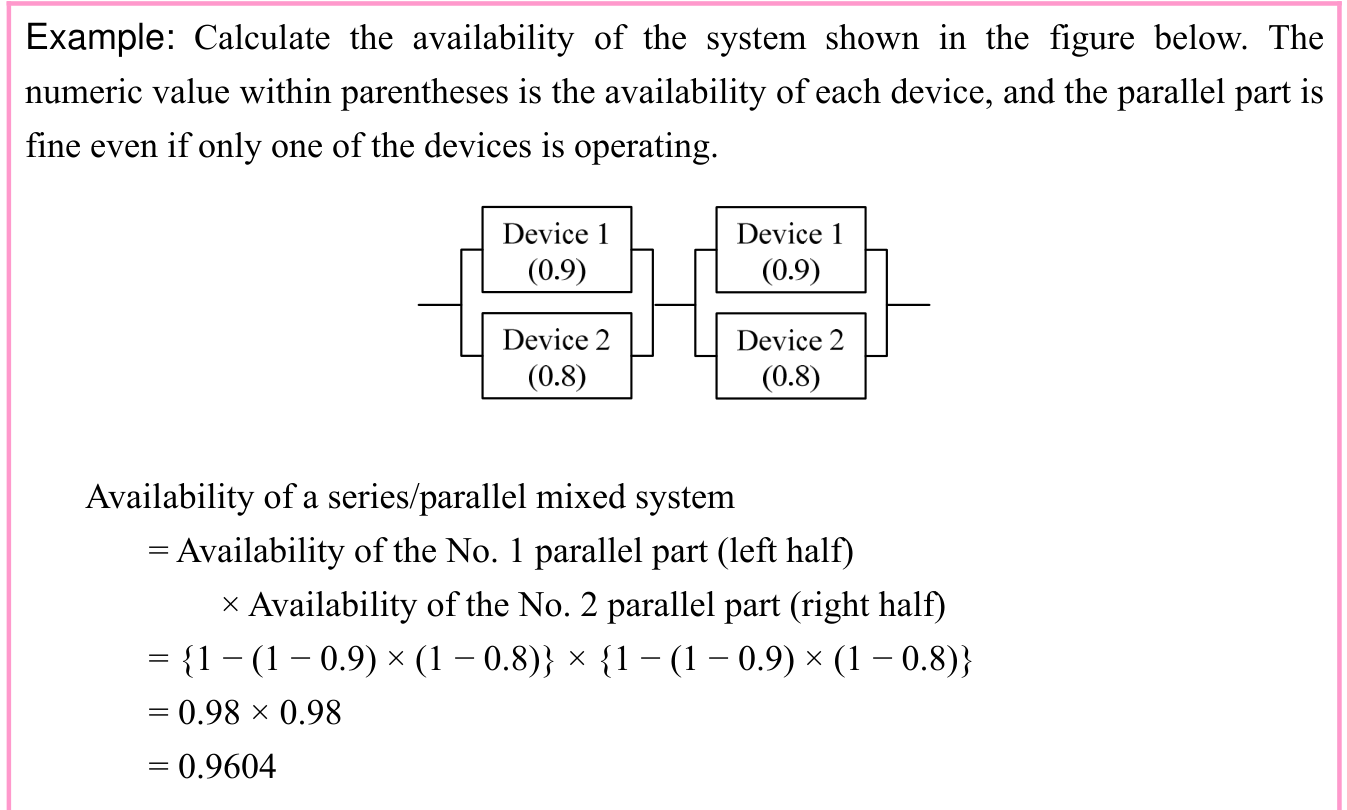
Original complete mixed series/parallel example. Two parallel pairs, each labeled device 1 (0.9) and device 2 (0.8), are connected in series. Either device can sustain its pair. Product {1−(1−0.9)×(1−0.8)}×{1−(1−0.9)×(1−0.8)}=0.98×0.98=0.9604. Question, labels, diagram and solution remain together.
p. 149 · Enlarge
Series and parallel system availability · 4 practice questions

(4) Failure rate of the system

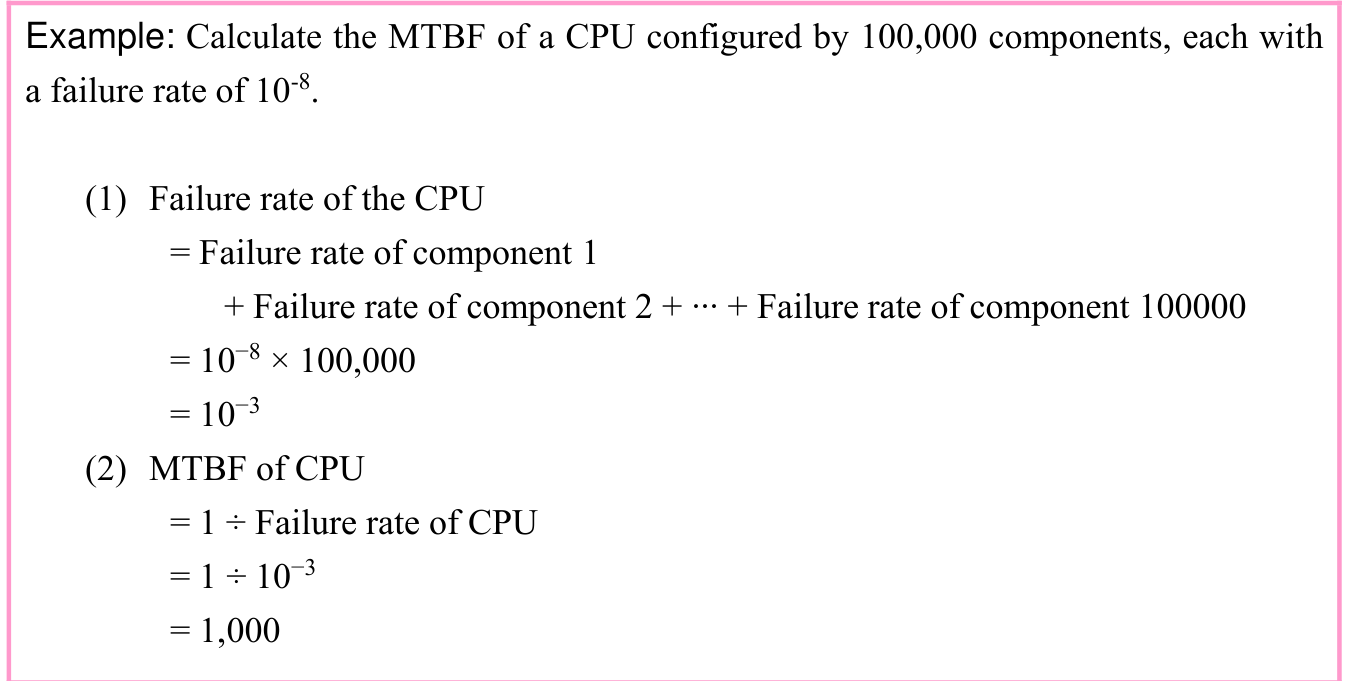
Failure rate is the probability of the occurrence of a failure (or a fault) in a device or system. Since a failure occurs once after the device has been operating for a fixed period of time, the failure rate of the individual device becomes the reciprocal of MTBF.

p. 150
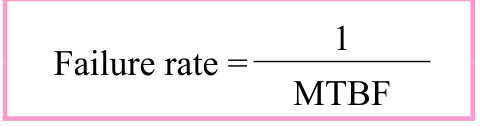
Original boxed stacked fraction: Failure rate equals 1 divided by MTBF.
p. 150 · Enlarge

Moreover, when several devices (or components) have been combined together, the overall failure rate becomes the total sum of the failure rate of each device (or component).

Original complete sum formula and note: Failure rate of the system equals sigma of the failure rate of each individual device. The source note says sigma indicates the total sum.
p. 150 · Enlarge
Original complete CPU MTBF example: 100,000 components, each failure rate 10 to the minus eighth. Summing gives 10^−8×100,000=10^−3. CPU MTBF=1 divided by 10^−3=1,000. All powers, question and two numbered solution stages remain intact.
p. 150 · Enlarge

If the change in the failure rate of the hardware is represented by a graph with the elapsed time plotted on the horizontal axis and the failure rate (or occurrence frequency of failure) plotted on the vertical axis, this results in a bathtub curve in most cases.

p. 151
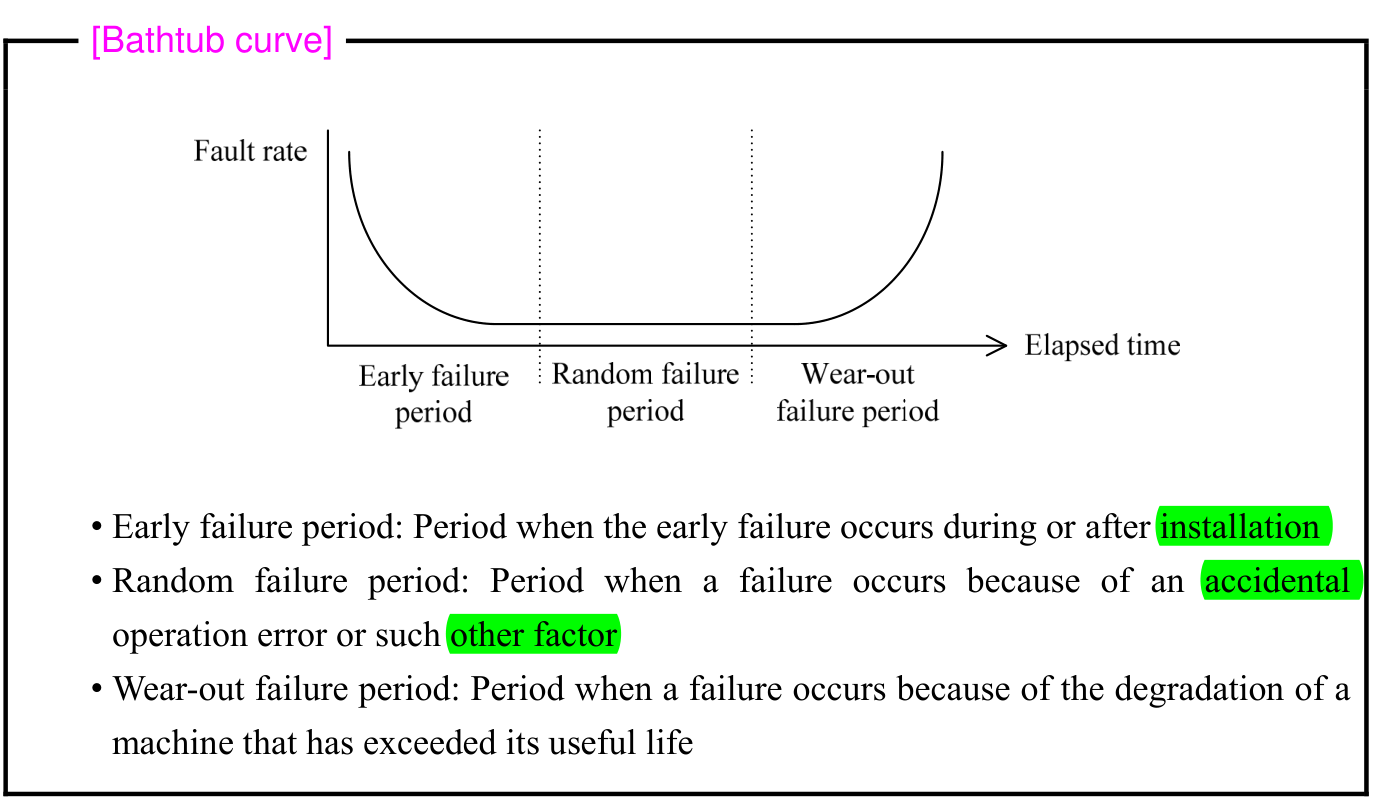
Original entire Bathtub curve box. Vertical axis Fault rate, horizontal axis Elapsed time. Curve falls during Early failure period, stays low during Random failure period, rises during Wear-out failure period. Original three explanatory bullets distinguish installation failures, accidental operation errors, and degradation after useful life. Heading, curve, arrows, dividers, labels and explanations are intact.
p. 151 · Enlarge

Original chapter exercises

Original chapter exercises →

New FE Textbook Vol.1 · IT Fundamentals · First Edition, April 2015