Highlighted text? Practice this concept. Highlighted passages and figures open related questions.
Practice related questions (15)Progress & bookmarks
Current section
2-2 Software Design Technique
p. 282
Practice this section 15 linked exam questions with default filters
Progress
Not marked complete
Related questions in this lesson 4
HIPO diagram components1Business processes and data flows1Original DFD symbols and meanings1State transition modeling1p. 282 · PDF 286
2 - 2 Software Design Technique
2-2-1 Structured Design
Structured design is a technique (i.e., structured technique) that analyzes and designs the functions required for software and the data flows used by each function. The technique in which development is focused on functions (i.e., processing) as in structured design is called the POA (Process-Oriented Approach) or process-oriented design. Structured design offers merits that include improvement of processing efficiency, ease of maintenance, and partitioning of modules into components (for reuse). In structured design, functions are incrementally refined according to the following procedures, and are placed into a hierarchical structure.
[Structured design procedures]
1) Identification of functions
2) Clarification of data flow
3) Grouping of functions
4) Hierarchical structuring
5) Determination of program functions
6) Documentation of functional specifications
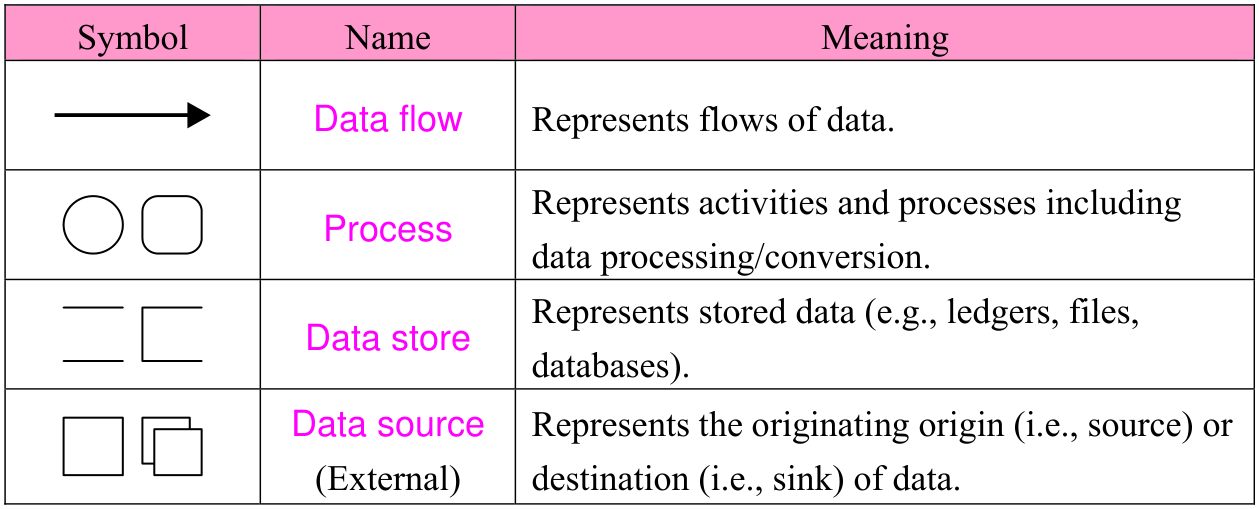
“1) Identification of functions” and “2) Clarification of data flow” are processes that correspond to the software requirements definition process, and are also called structured analysis. In structured analysis, work processes, and others are analyzed by using diagramming methods as shown below, and the functions necessary for the software are clarified.
p. 283 · PDF 287

Source visual description
The original DFD table has Symbol, Name and Meaning columns. Data flow is a right-pointing arrow and represents flows of data. Process is shown as a circle or rounded rectangle and represents activities and processes including data processing/conversion. Data store is shown with parallel horizontal lines and an open-sided box and represents stored data, such as ledgers, files and databases. Data source (External) is shown as single and overlapping rectangles and represents the origin (source) or destination (sink) of data.
“3) Grouping of functions” through “6) Documentation of functional specifications” are processes that correspond to the software architectural design process and the software detailed design process. In these processes, functions required for software are organized (i.e., classified) and analyzed by using diagramming methods as shown below, and functional hierarchies are made clear through stepwise refinement.
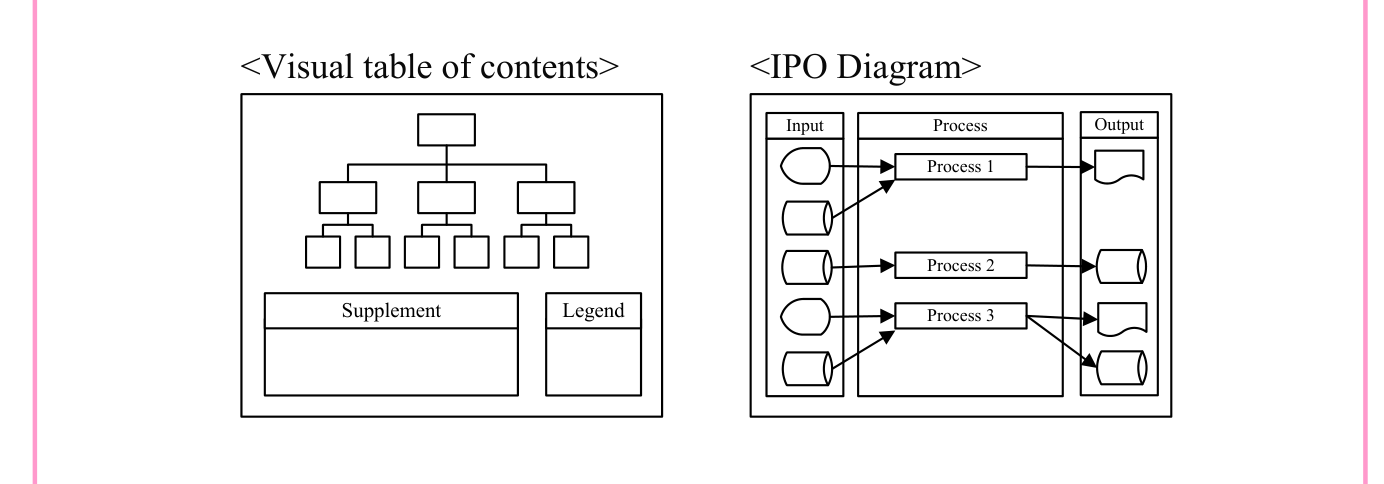
- • HIPO (Hierarchy plus Input Process Output)
This is a diagramming method that represents the functions and processing of software by using a hierarchical structure.

Source visual description
The Visual table of contents shows one top box, three middle boxes, and two children below each middle box, above Supplement and Legend areas. The IPO Diagram has Input, Process and Output columns and exactly three process boxes: Process 1, Process 2 and Process 3. The top two inputs point to Process 1, the third input to Process 2, and the bottom two inputs to Process 3. Process 1 outputs a document, Process 2 a cylinder, and Process 3 both a document and a cylinder. The original input and output shapes and connections are retained.
p. 284 · PDF 288
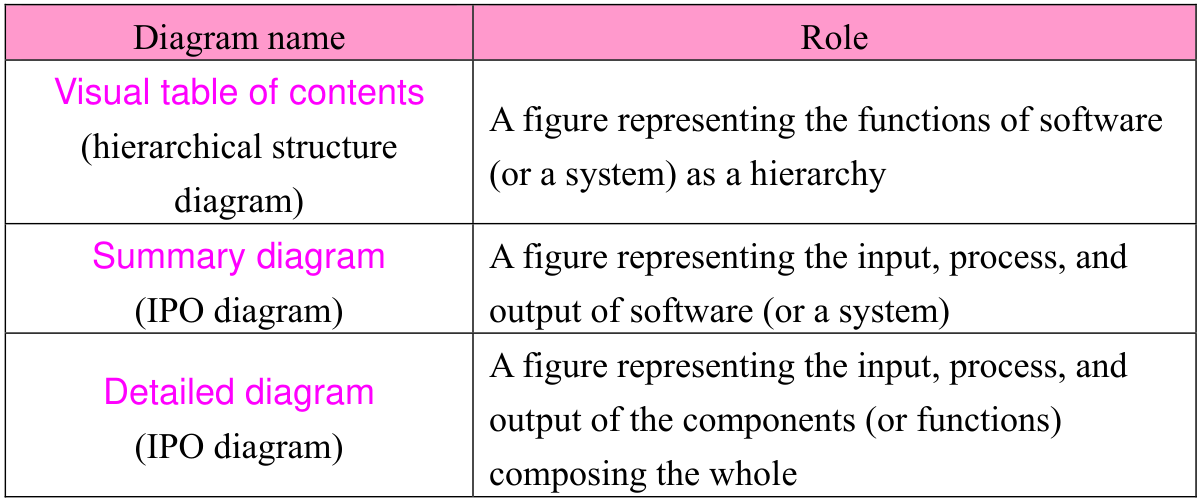
| Diagram name | Role |
|---|---|
| Visual table of contents (hierarchical structure diagram) | A figure representing the functions of software (or a system) as a hierarchy |
| Summary diagram (IPO diagram) | A figure representing the input, process, and output of software (or a system) |
| Detailed diagram (IPO diagram) | A figure representing the input, process, and output of the components (or functions) composing the whole |

- • Jackson method / Warnier method
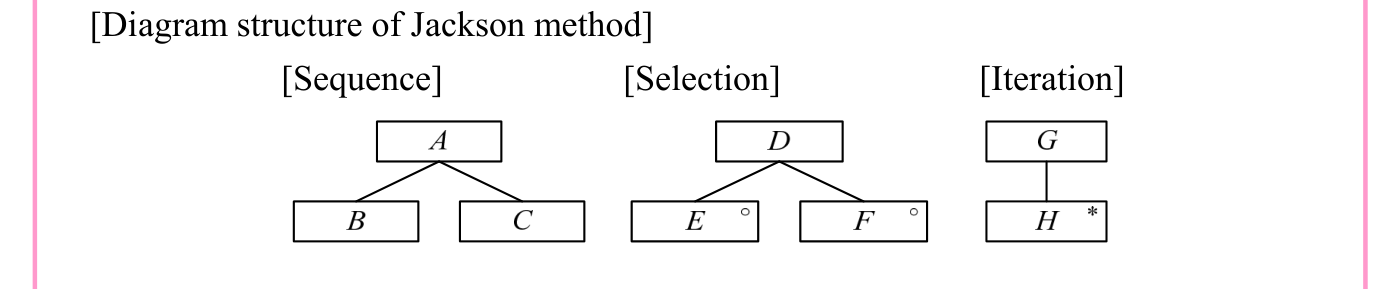
This is a module partitioning technique that is focused on data structures. Each technique defines functional structure diagrams that correspond to data structures.

Source visual description
Diagram structure of Jackson method: Sequence has A above children B and C. Selection has D above E and F; E and F each carry a small open circle. Iteration has G above H, and H carries an asterisk. The source labels these Sequence, Selection and Iteration.
- • Process flow
This is a diagramming method that represents the execution order (i.e., flow) of processing (i.e., functions), along with interfaces (e.g., input/output).

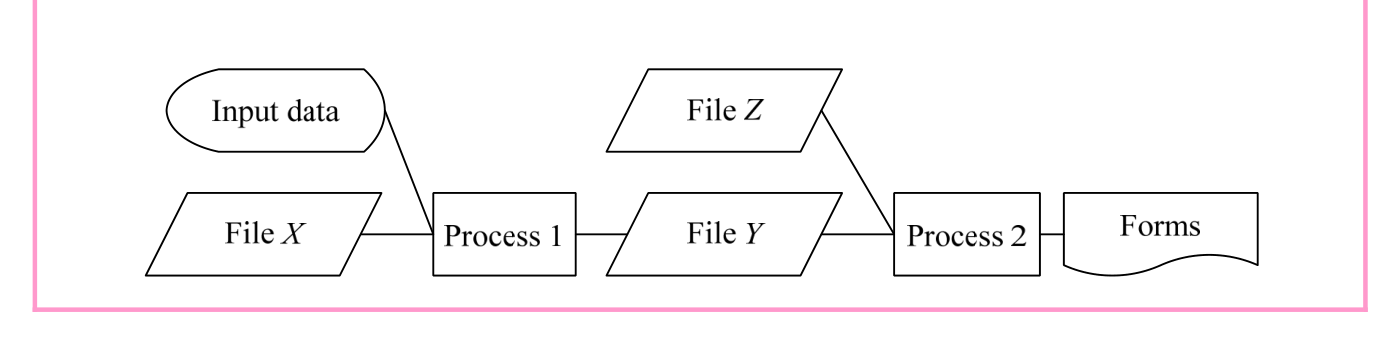
Source visual description
Input data in an oval and File X feed Process 1. Process 1 feeds File Y, which feeds Process 2. File Z also feeds Process 2. Process 2 produces Forms, shown as a document shape. The original file parallelograms, process rectangles, lines and shapes are retained.
Structured charts as shown below are used to represent the processing procedures of each function (i.e., program) in “6) Documentation of functional specifications.” A structured chart is a chart suited to structured programming, in which processing procedures are considered according to the structured theorem that states that a program with one entrance and one exit can be represented as a combination of three basic structural units (sequence, selection, and iteration).
p. 285 · PDF 289
- • Flowchart
This is a commonly used method of algorithm notation. It represents processing procedures by using combinations of symbols, and has the merit of being easy to understand visually.

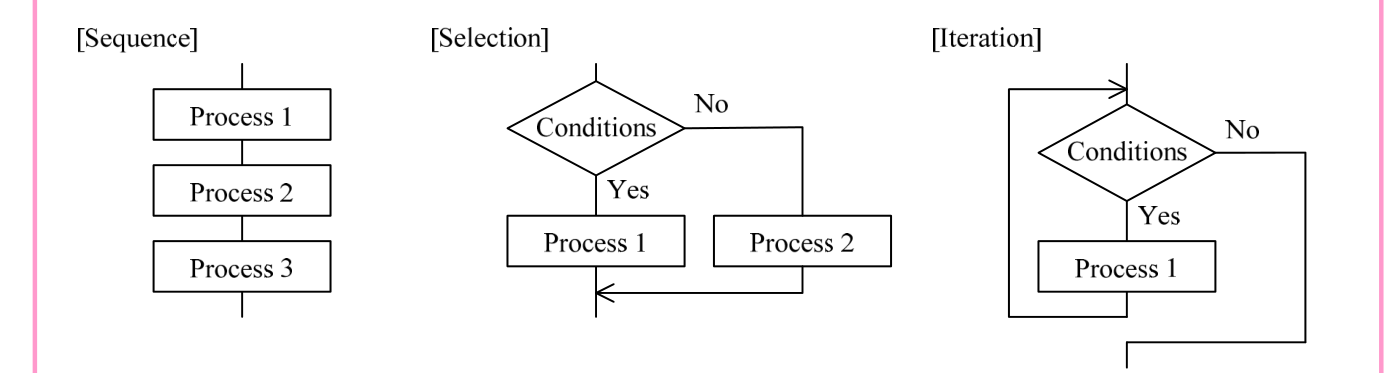
Source visual description
Sequence proceeds vertically through Process 1, Process 2 and Process 3. Selection enters a Conditions diamond: Yes descends to Process 1, No goes right to Process 2, and both branches merge below. Iteration enters Conditions: Yes descends through Process 1 and loops back to the decision; No leaves to the right and exits below.
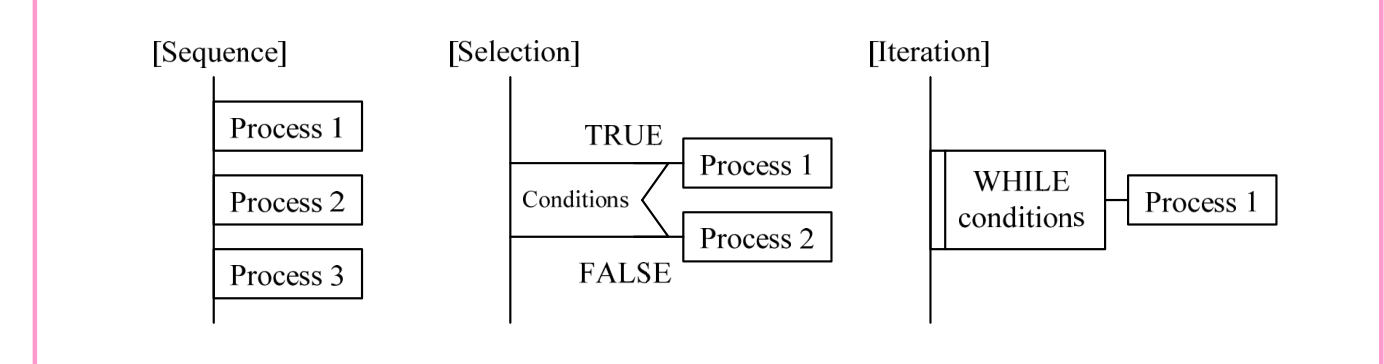
- • NS (Nassi-Shneiderman) chart
This represents the basic control structure (i.e., sequence, selection, iteration) by using quadrilaterals.


Source visual description
Nassi-Shneiderman charts: Sequence stacks Process 1, Process 2 and Process 3. Selection has a Conditions header divided into TRUE and FALSE sides above Process 1 and Process 2. Iteration encloses Process 1 beneath a WHILE conditions header.
- • PAD (Problem Analysis Diagram)
This represents the logical structure of algorithms by using a tree structure.

Source visual description
Problem Analysis Diagrams: Sequence places Process 1, Process 2 and Process 3 along a vertical structure. Selection has a Conditions branch with TRUE leading to Process 1 and FALSE to Process 2. Iteration has a WHILE conditions box and a linked Process 1 box. Original tree structure and branch directions remain as drawn.
By performing hierarchical structuring and stepwise refinement of functions through structured design, the software structure is refined in the following order: software configuration items → software components → software units (i.e., modules). In stepwise refinement, the fulfillment of software requirements and software quality characteristics (i.e., functionality, reliability, usability, efficiency, maintainability, portability) must not be forgotten. In addition, in partitioning into software units (module partitioning), care should be taken to perform optimal module partitioning by evaluating module independence through module strength and module coupling.
Section progress
Original chapter exercises
Original chapter exercises →New FE Textbook Vol.2 · First Edition, April 2015