Highlighted text? Practice this concept. Highlighted passages and figures open related questions.
Practice related questions (4)Progress & bookmarks
Current section
2-3 Project Time Management
p. 320
Practice this section 4 linked exam questions with default filters
Progress
Not marked complete
Related questions in this lesson 7
Three-point duration estimation1EVM schedule variance1Resource and duration estimation2Earned value of completed work1EVM cost performance index2SPI equals EV divided by PV1p. 320 · PDF 324
2 - 3 Project Time Management
The purpose of project time management is to clarify and control the schedule for completing the project within the defined period.
p. 321 · PDF 325
The following processes are implemented for setting up and controlling the schedule.
| Process groups | Process to implement |
|---|---|
| Initiating | – |
| Planning | [Plan schedule management] |
| [Define activities] | |
| Sequence activities | |
| [Estimate activity resources] | |
| Estimate activity durations | |
| Develop schedule | |
| Implementing [Executing] | – |
| Controlling [Monitoring and controlling] | Control schedule |
| Closing | – |
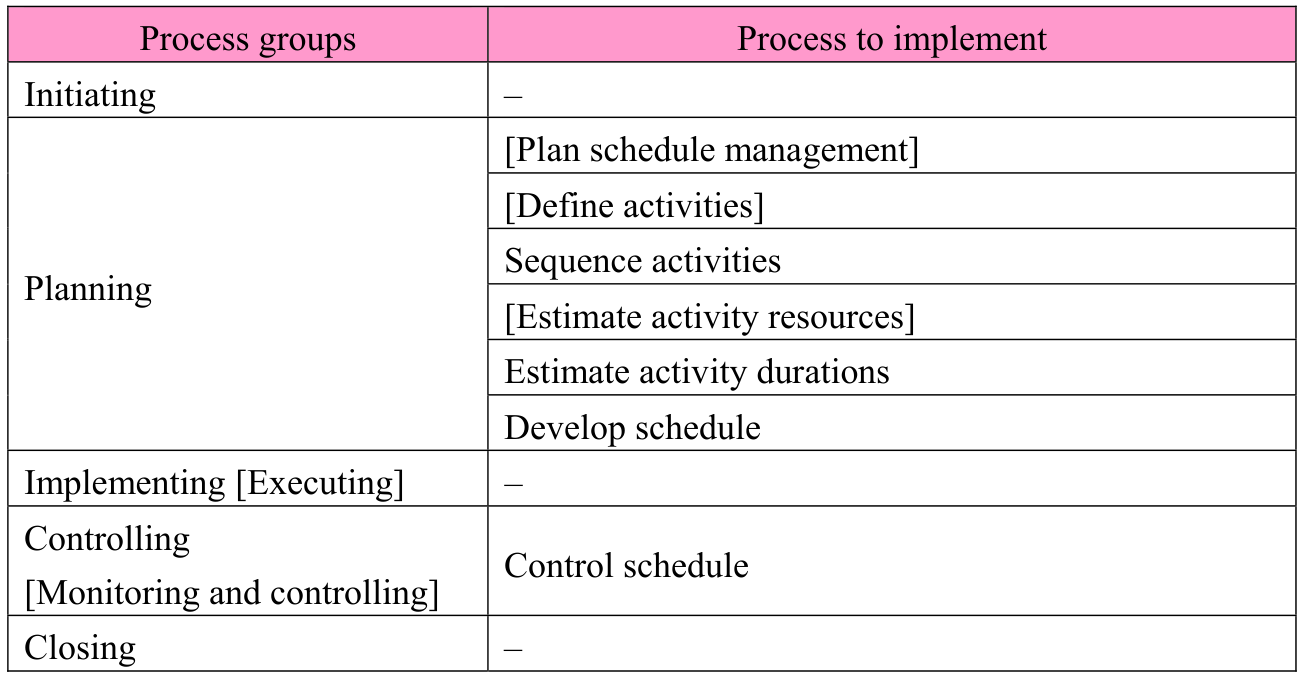
Note: The terms enclosed in brackets [ ] are used only in PMBOK.
(1) Schedule management plan
This process creates a schedule model (e.g., the scheduling method and the tools used) and a schedule management plan that describes the performance measurement method on the basis of the overview of the overall schedule (i.e., summary milestone schedule) described in
the project charter and the project management plan and the auxiliary plan.
(2) Definition of activities / sequencing of activities
During activity definition, an activity, which is the unit obtained by further refinement of the work package that is the lowermost hierarchy of WBS, is clearly identified. To achieve this, by using the activity definition level that is specified in the scope baseline (or WBS) and the schedule management plan, the work package is refined into activities, and an activity list is developed. At the same time, the milestones are identified, which act as important points of time in the work process (e.g., the start date/end date, or review date of the work process) that has an important meaning in the project, and then a milestone list is created. The activities that are clearly identified through activity definition are arranged on the basis of a logical order relation with the help of an arrow diagram and PDM (Precedence Diagramming Method), and integrated into a project schedule network diagram. At this time, the following two dependencies are also decided: a lead during which a later activity can be started ahead of schedule without waiting for an earlier activity to complete, and a lag during which the start of a later activity is delayed even when an earlier activity is completed.
p. 322 · PDF 326
- • PDM (Precedence Diagramming Method)
It is a technique used in CPM (Critical Path Method) according to which activities are represented through quadrangles and the logical order relation between activities is represented through arrows.
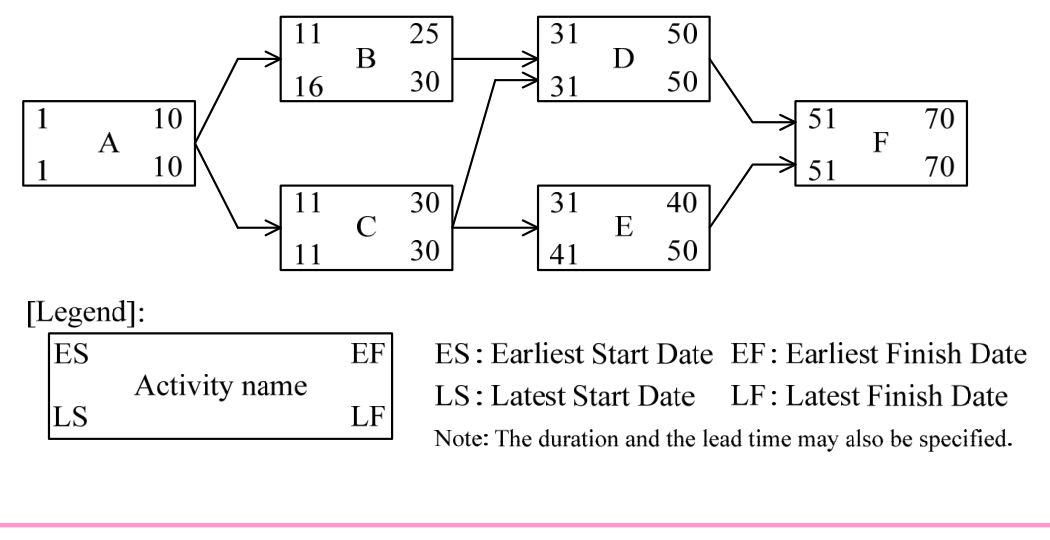
Accessible diagram transcription
PDM network. Activity A leads to B and C. B leads to D. C leads to D and E. D and E lead to F.
| Activity name | ES | EF | LS | LF |
|---|---|---|---|---|
| A | 1 | 10 | 1 | 10 |
| B | 11 | 25 | 16 | 30 |
| C | 11 | 30 | 11 | 30 |
| D | 31 | 50 | 31 | 50 |
| E | 31 | 40 | 41 | 50 |
| F | 51 | 70 | 51 | 70 |
- ES: Earliest Start Date
- EF: Earliest Finish Date
- LS: Latest Start Date
- LF: Latest Finish Date
- Note: The duration and the lead time may also be specified.
(3) Estimate of activity resources
This process estimates the resources (e.g., staff members, devices, materials) that are required for executing each activity. On the basis of the resource calendar that is created through project human resource management and project procurement management or the activity cost estimate that is performed through project cost management, the type and quantity of the required resources are documented as an activity resource request list. Also, a RBS (Resource Breakdown Structure) is developed in which the resources to be used are classified hierarchically according to the category and the type.
(4) Estimate of activity durations
- • Analogous estimate
This is a technique of relative estimate on the basis of the performance of a similar project in the past. - • Parametric estimate
This is a technique of estimate in which the past information is statistically analyzed and various coefficients are determined.
- • Three-point estimate
p. 323 · PDF 327
- • Reserve analysis
This is a technique of estimate in which a reserve (i.e., buffer) is provided beforehand.
(5) Development of a schedule
This process creates a master schedule, an intermediate schedule (e.g., activity schedule by process), and a detailed schedule (e.g., weekly activity schedule) by using the scheduling method defined in the schedule management plan on the basis of the activity list, the activity resource requirements and resource calendar, and the estimate of activity durations. During schedule development, schedule network analysis is performed by using the following techniques, and then various schedules are created.
- • PERT (Program Evaluation and Review Technique)
This is a technique that makes use of an arrow diagram. (Refer to p.59 for details.) - • CPM (Critical Path Method)
This is a technique that makes use of an arrow diagram and PDM (Precedence Diagramming Method), and the basic concept is almost the same as PERT. - • Critical chain
This is a technique by which schedule correction is enabled in order to meet the end date with limited resources by adding an activity (i.e., buffer) that does not involve
actual work.
- • Resource leveling
This is a resource optimization technique by which the amount of usage of specific resources is maintained at a constant level. - • Schedule compression
This includes techniques such as crashing in which the schedule is compressed by introducing resources such as staff members and cost, and fast-tracking in which the schedule is compressed through subdivision/parallel execution of specific activities and by proceeding with the succeeding process in parallel before the completion of the previous process.
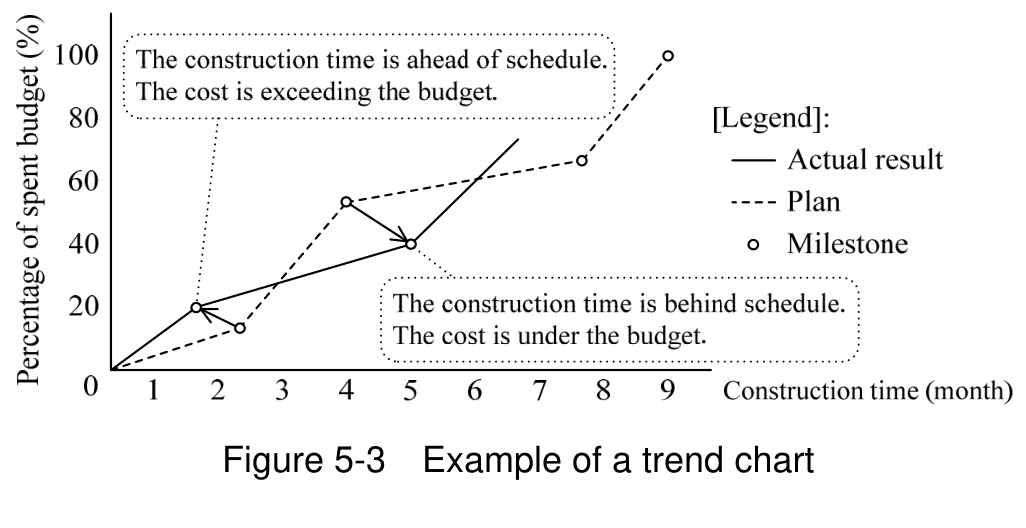
The result of schedule development is documented as the schedule baseline. The schedule defined as the baseline is used as the decision criteria during monitoring and controlling. The schedule thus created is compiled in a Gantt chart that is used to manage the progress status
by drawing horizontal bars representing the activity schedule (i.e., plan) and actual values on the upper and lower bars, and in a trend chart in which is used to perform the cost management
p. 324 · PDF 328
and the progress management by representing and comparing the schedule and actual result of milestones through a line graph.
Accessible diagram transcription
Figure 5-3 Example of a trend chart. Vertical axis: Percentage of spent budget (%), marked 0, 20, 40, 60, 80, 100. Horizontal axis: Construction time (month), marked 1 through 9. Legend: solid line Actual result; dashed line Plan; open circle Milestone.
- The construction time is ahead of schedule. The cost is exceeding the budget.
- The construction time is behind schedule. The cost is under the budget.
(6) Control of the schedule
This process monitors and understands the progress status (i.e., schedule) of the project, and if there is a significant delay or an unexpected event has occurred, the changes are determined or approved through integrated change control, and the schedule is quickly readjusted (or the schedule baseline is changed). The progress status of the schedule is understood by performing variance analysis of the activity performance data (e.g., the start status, work status, the completion status of an activity) created on the basis of the progress report that is submitted by the project members by using techniques
such as EVM.
- • EVM (Earned Value Management)
This is a technique of quantifying and evaluating the progress of a project and the productivity (i.e., performance) of activities on the basis of the value of the amount of work completed (normally converted to the amount of money).
[Basic indicators of EVM]
- • PV (Planned Value)
This is the amount (i.e., cost) assigned to each activity during planning. - • EV (Earned Value)
This is the amount (i.e., cost) originally assigned to an activity completed at a recent point in time. · 1 question - • AC (Actual Cost)
This is the cost that was actually required for an activity completed at a recent point in time.
[Performance indicators of EVM]
(1) Performance indicators of progress
p. 325 · PDF 329
- • SV (Schedule Variance)
This is an indicator of the difference as seen from the viewpoint of the schedule of each activity. If it is more than 0, the progress of the project is ahead of the schedule.
- • SPI (Schedule Performance Index)
This is an index of the efficiency as seen from the viewpoint of the schedule of each activity. If it is more than 1, the work efficiency is good; that is, the progress of the project is ahead of schedule.
(2) Performance indicators of productivity
- • CV (Cost Variance)
This is an indicator of the difference as seen from the viewpoint of the cost of each activity. If it is more than 0, the productivity is high.
CV = EV − AC
- • CPI (Cost Performance Index)
This is an index of the efficiency as seen from the viewpoint of the cost of each activity. If it is more than 1, the cost efficiency is good; that is, the productivity is high.
Section progress
Original chapter exercises
Original chapter exercises →New FE Textbook Vol.2 · First Edition, April 2015